Fibonacci and Gann Applications in Financial Markets
Fibonacci and Gann Applications in Financial Markets
Fibonacci and Gann Applications in Financial Markets

You also want an ePaper? Increase the reach of your titles
YUMPU automatically turns print PDFs into web optimized ePapers that Google loves.
<strong>Gann</strong>, The Misunderstood Analysis 147<br />
application <strong>and</strong> gives some excellent entry <strong>and</strong> exit po<strong>in</strong>ts. It is a pity that this form<br />
of chart<strong>in</strong>g is even less popular than Po<strong>in</strong>t <strong>and</strong> Figure chart<strong>in</strong>g, as it is simple to use<br />
<strong>in</strong> the extreme.<br />
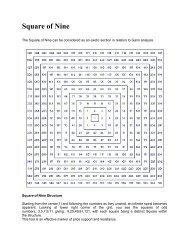
BASIC CONSTRUCTION OF A GANN SWING CHART<br />
The trend <strong>in</strong>dicator l<strong>in</strong>e (TIL) is based simply on the relationship between daily<br />
highs <strong>and</strong> lows. If <strong>in</strong> day 2 the high is higher than that <strong>in</strong> day 1, then the l<strong>in</strong>e moves<br />
up to that level, but if the low is lower <strong>in</strong> day 2 then the l<strong>in</strong>e moves down to there.<br />
Inside days, where current high <strong>and</strong> low are <strong>in</strong>side the previous day’s range, are generally<br />
ignored, except for occasions when a reversal follows from an <strong>in</strong>side day. In<br />
the case of outside days, where the current high <strong>and</strong> low are outside the range of the<br />
previous day, draw the TIL to whichever of the high or low occurred first dur<strong>in</strong>g the<br />
session <strong>and</strong> then reverse it to the other extreme.<br />
ENTRY AND EXIT STRATEGY<br />
A strong buy signal is given once a sw<strong>in</strong>g chart base has been formed <strong>and</strong> the price<br />
action breaks out of the range. The reverse is true of a sell signal, where congestive<br />
highs <strong>in</strong> the sw<strong>in</strong>g chart are needed first <strong>and</strong> then the range breakout happens.<br />
As <strong>in</strong> all good techniques, stop loss levels are critical. These are set at the last<br />
change of direction <strong>in</strong> TIL level, as <strong>in</strong>dicated <strong>in</strong> the sw<strong>in</strong>g chart of Figure 9.1. This<br />
is really all the chart<strong>in</strong>g that is necessary to give an <strong>in</strong>sight <strong>in</strong>to the market direction.<br />
The most serious <strong>and</strong> approachable of <strong>Gann</strong>’s theories <strong>in</strong>volves the relationship<br />
between price <strong>and</strong> time. <strong>Gann</strong> believed that this relationship was key to market action<br />
<strong>and</strong> that price <strong>and</strong> time were <strong>in</strong>exorably l<strong>in</strong>ked. Here the strongest relationship is<br />
between the change <strong>in</strong> price by one unit <strong>and</strong> that of time by one unit, usually a day. A<br />
straight l<strong>in</strong>e can be drawn on a daily chart show<strong>in</strong>g this relationship, which appears as<br />
a 45° l<strong>in</strong>e on a chart. Subord<strong>in</strong>ate relationships are also important, such as one of price<br />
to two of time, two of price to one of time <strong>and</strong> so on. Draw<strong>in</strong>g these on a daily barchart<br />
gives the ‘fan’ pattern as seen later <strong>in</strong> Figure 9.7. This is a fairly ‘fixed’ system<br />
to apply to a chart <strong>and</strong> there is very little room for manoeuvre from these fixed<br />
amounts, but the analyst has to remember that <strong>Gann</strong> was talk<strong>in</strong>g about prices with<strong>in</strong> a<br />
360 day year <strong>and</strong> <strong>in</strong>deed with<strong>in</strong> 32nds of a dollar, mak<strong>in</strong>g the prices themselves l<strong>in</strong>k<br />
clearly with the degrees of a circle. Although there is noth<strong>in</strong>g wrong with us<strong>in</strong>g decimal<br />
pric<strong>in</strong>g <strong>in</strong> <strong>Gann</strong> analysis, the analyst has to ensure <strong>and</strong> remember that all possible<br />
prices that can be generated with<strong>in</strong> the market are not equally important <strong>and</strong> that quarters,<br />
eights <strong>and</strong> so on are much more important <strong>in</strong> <strong>Gann</strong> analysis than decimals. There