

Draft first regional report on the implementation of the Montevideo Consensus on Population and Development
This draft report seeks to give an account of progress in the implementation of the priority measures of the Montevideo Consensus on Population and Development in the region, as well as the differences between countries in terms of the degree of implementation. By highlighting relevant national experiences, it also seeks to facilitate the exchange of good practices among countries so that they can benefit from each other in their efforts to advance the implementation of the actions of the Montevideo Consensus.
This draft report seeks to give an account of progress in the implementation of the priority measures of the Montevideo Consensus on Population and Development in the region, as well as the differences between countries in terms of the degree of implementation. By highlighting relevant national experiences, it also seeks to facilitate the exchange of good practices among countries so that they can benefit from each other in their efforts to advance the implementation of the actions of the Montevideo Consensus.

You also want an ePaper? Increase the reach of your titles
YUMPU automatically turns print PDFs into web optimized ePapers that Google loves.
<str<strong>on</strong>g>Draft</str<strong>on</strong>g> <str<strong>on</strong>g>first</str<strong>on</strong>g> <str<strong>on</strong>g>regi<strong>on</strong>al</str<strong>on</strong>g> <str<strong>on</strong>g>report</str<strong>on</strong>g> <strong>on</strong> <strong>the</strong> implementati<strong>on</strong> <strong>of</strong> <strong>the</strong> M<strong>on</strong>tevideo C<strong>on</strong>sensus <strong>on</strong> Populati<strong>on</strong> <strong>and</strong> <strong>Development</strong><br />
Chapter III<br />
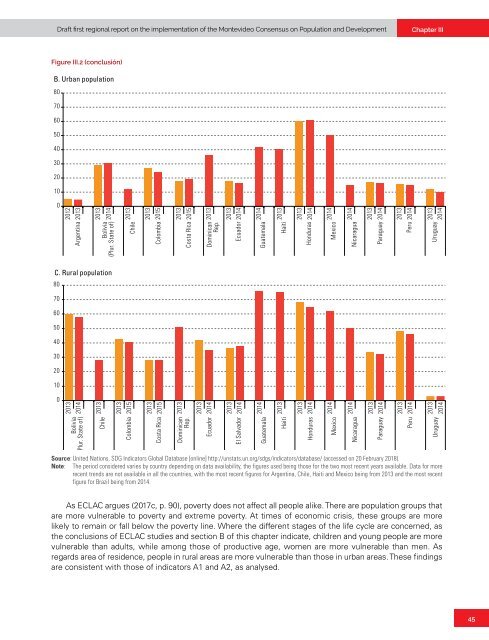
Figure III.2 (c<strong>on</strong>clusión)<br />
B. Urban populati<strong>on</strong><br />
80<br />
70<br />
60<br />
50<br />
40<br />
30<br />
20<br />
10<br />
0<br />
Argentina<br />
Bolivia<br />
(Plur. State <strong>of</strong>)<br />
Chile<br />
Colombia<br />
Costa Rica<br />
Dominican<br />
Rep.<br />
Ecuador<br />
Guatemala<br />
Haiti<br />
H<strong>on</strong>duras<br />
Mexico<br />
Nicaragua<br />
Paraguay<br />
Peru<br />
Uruguay<br />
2012<br />
2013<br />
2013<br />
2014<br />
2013<br />
2013<br />
2015<br />
2013<br />
2015<br />
2013<br />
2013<br />
2014<br />
2014<br />
2013<br />
2013<br />
2014<br />
2014<br />
2014<br />
2013<br />
2014<br />
2013<br />
2014<br />
2013<br />
2014<br />
C. Rural populati<strong>on</strong><br />
80<br />
70<br />
60<br />
50<br />
40<br />
30<br />
20<br />
10<br />
0<br />
Bolivia<br />
(Plur. State <strong>of</strong>)<br />
Chile<br />
Colombia<br />
Costa Rica<br />
Dominican<br />
Rep.<br />
Ecuador<br />
El Salvador<br />
Guatemala<br />
Haiti<br />
H<strong>on</strong>duras<br />
Mexico<br />
Nicaragua<br />
Paraguay<br />
Peru<br />
Uruguay<br />
2013<br />
2014<br />
2013<br />
2013<br />
2015<br />
2013<br />
2015<br />
2013<br />
2013<br />
2014<br />
2013<br />
2014<br />
2014<br />
2013<br />
2013<br />
2014<br />
2014<br />
2014<br />
2013<br />
2014<br />
2013<br />
2014<br />
2013<br />
2014<br />
Source: United Nati<strong>on</strong>s, SDG Indicators Global Database [<strong>on</strong>line] http://unstats.un.org/sdgs/indicators/database/ (accessed <strong>on</strong> 20 February 2018).<br />
Note: The period c<strong>on</strong>sidered varies by country depending <strong>on</strong> data availability, <strong>the</strong> figures used being those for <strong>the</strong> two most recent years available. Data for more<br />
recent trends are not available in all <strong>the</strong> countries, with <strong>the</strong> most recent figures for Argentina, Chile, Haiti <strong>and</strong> Mexico being from 2013 <strong>and</strong> <strong>the</strong> most recent<br />
figure for Brazil being from 2014.<br />
As ECLAC argues (2017c, p. 90), poverty does not affect all people alike. There are populati<strong>on</strong> groups that<br />
are more vulnerable to poverty <strong>and</strong> extreme poverty. At times <strong>of</strong> ec<strong>on</strong>omic crisis, <strong>the</strong>se groups are more<br />
likely to remain or fall below <strong>the</strong> poverty line. Where <strong>the</strong> different stages <strong>of</strong> <strong>the</strong> life cycle are c<strong>on</strong>cerned, as<br />
<strong>the</strong> c<strong>on</strong>clusi<strong>on</strong>s <strong>of</strong> ECLAC studies <strong>and</strong> secti<strong>on</strong> B <strong>of</strong> this chapter indicate, children <strong>and</strong> young people are more<br />
vulnerable than adults, while am<strong>on</strong>g those <strong>of</strong> productive age, women are more vulnerable than men. As<br />
regards area <strong>of</strong> residence, people in rural areas are more vulnerable than those in urban areas. These findings<br />
are c<strong>on</strong>sistent with those <strong>of</strong> indicators A1 <strong>and</strong> A2, as analysed.<br />
45


