

Draft first regional report on the implementation of the Montevideo Consensus on Population and Development
This draft report seeks to give an account of progress in the implementation of the priority measures of the Montevideo Consensus on Population and Development in the region, as well as the differences between countries in terms of the degree of implementation. By highlighting relevant national experiences, it also seeks to facilitate the exchange of good practices among countries so that they can benefit from each other in their efforts to advance the implementation of the actions of the Montevideo Consensus.
This draft report seeks to give an account of progress in the implementation of the priority measures of the Montevideo Consensus on Population and Development in the region, as well as the differences between countries in terms of the degree of implementation. By highlighting relevant national experiences, it also seeks to facilitate the exchange of good practices among countries so that they can benefit from each other in their efforts to advance the implementation of the actions of the Montevideo Consensus.

You also want an ePaper? Increase the reach of your titles
YUMPU automatically turns print PDFs into web optimized ePapers that Google loves.
Chapter III<br />
Ec<strong>on</strong>omic Commissi<strong>on</strong> for Latin America <strong>and</strong> <strong>the</strong> Caribbean (ECLAC)<br />
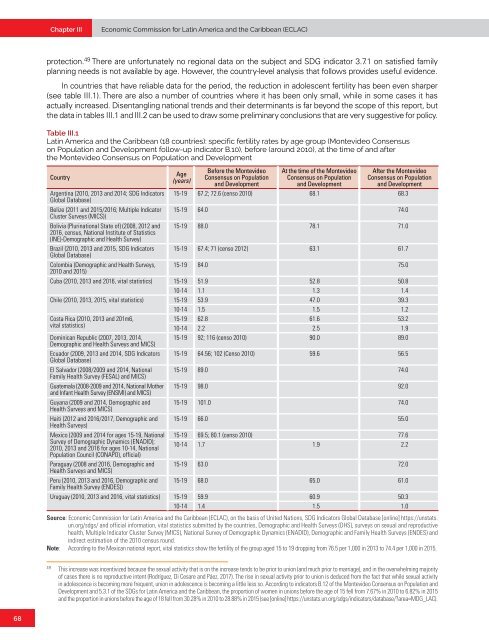
protecti<strong>on</strong>. 49 There are unfortunately no <str<strong>on</strong>g>regi<strong>on</strong>al</str<strong>on</strong>g> data <strong>on</strong> <strong>the</strong> subject <strong>and</strong> SDG indicator 3.7.1 <strong>on</strong> satisfied family<br />
planning needs is not available by age. However, <strong>the</strong> country-level analysis that follows provides useful evidence.<br />
In countries that have reliable data for <strong>the</strong> period, <strong>the</strong> reducti<strong>on</strong> in adolescent fertility has been even sharper<br />
(see table III.1). There are also a number <strong>of</strong> countries where it has been <strong>on</strong>ly small, while in some cases it has<br />
actually increased. Disentangling nati<strong>on</strong>al trends <strong>and</strong> <strong>the</strong>ir determinants is far bey<strong>on</strong>d <strong>the</strong> scope <strong>of</strong> this <str<strong>on</strong>g>report</str<strong>on</strong>g>, but<br />
<strong>the</strong> data in tables III.1 <strong>and</strong> III.2 can be used to draw some preliminary c<strong>on</strong>clusi<strong>on</strong>s that are very suggestive for policy.<br />
Table III.1<br />
Latin America <strong>and</strong> <strong>the</strong> Caribbean (18 countries): specific fertility rates by age group (M<strong>on</strong>tevideo C<strong>on</strong>sensus<br />
<strong>on</strong> Populati<strong>on</strong> <strong>and</strong> <strong>Development</strong> follow-up indicator B.10), before (around 2010), at <strong>the</strong> time <strong>of</strong> <strong>and</strong> after<br />
<strong>the</strong> M<strong>on</strong>tevideo C<strong>on</strong>sensus <strong>on</strong> Populati<strong>on</strong> <strong>and</strong> <strong>Development</strong><br />
Country<br />
Age<br />
(years)<br />
Before <strong>the</strong> M<strong>on</strong>tevideo<br />
C<strong>on</strong>sensus <strong>on</strong> Populati<strong>on</strong><br />
<strong>and</strong> <strong>Development</strong><br />
At <strong>the</strong> time <strong>of</strong> <strong>the</strong> M<strong>on</strong>tevideo<br />
C<strong>on</strong>sensus <strong>on</strong> Populati<strong>on</strong><br />
<strong>and</strong> <strong>Development</strong><br />
After <strong>the</strong> M<strong>on</strong>tevideo<br />
C<strong>on</strong>sensus <strong>on</strong> Populati<strong>on</strong><br />
<strong>and</strong> <strong>Development</strong><br />
Argentina (2010, 2013 <strong>and</strong> 2014; SDG Indicators 15-19 67.2; 72.6 (censo 2010) 68.1 68.3<br />
Global Database)<br />
Belize (2011 <strong>and</strong> 2015/2016; Multiple Indicator 15-19 64.0 74.0<br />
Cluster Surveys (MICS))<br />
Bolivia (Plurinati<strong>on</strong>al State <strong>of</strong>) (2008, 2012 <strong>and</strong> 15-19 88.0 78.1 71.0<br />
2016, census, Nati<strong>on</strong>al Institute <strong>of</strong> Statistics<br />
(INE)-Demographic <strong>and</strong> Health Survey)<br />
Brazil (2010, 2013 <strong>and</strong> 2015, SDG Indicators 15-19 67.4; 71 (censo 2012) 63.1 61.7<br />
Global Database)<br />
Colombia (Demographic <strong>and</strong> Health Surveys, 15-19 84.0 75.0<br />
2010 <strong>and</strong> 2015)<br />
Cuba (2010, 2013 <strong>and</strong> 2016, vital statistics) 15-19 51.9 52.8 50.8<br />
10-14 1.1 1.3 1.4<br />
Chile (2010, 2013, 2015, vital statistics) 15-19 53.9 47.0 39.3<br />
10-14 1.5 1.5 1.2<br />
Costa Rica (2010, 2013 <strong>and</strong> 201m6,<br />
vital statistics)<br />
Dominican Republic (2007, 2013, 2014,<br />
Demographic <strong>and</strong> Health Surveys <strong>and</strong> MICS)<br />
Ecuador (2009, 2013 <strong>and</strong> 2014, SDG Indicators<br />
Global Database)<br />
El Salvador (2008/2009 <strong>and</strong> 2014, Nati<strong>on</strong>al<br />
Family Health Survey (FESAL) <strong>and</strong> MICS)<br />
Guatemala (2008-2009 <strong>and</strong> 2014, Nati<strong>on</strong>al Mo<strong>the</strong>r<br />
<strong>and</strong> Infant Health Survey (ENSMI) <strong>and</strong> MICS)<br />
Guyana (2009 <strong>and</strong> 2014, Demographic <strong>and</strong><br />
Health Surveys <strong>and</strong> MICS)<br />
Haiti (2012 <strong>and</strong> 2016/2017, Demographic <strong>and</strong><br />
Health Surveys)<br />
Mexico (2009 <strong>and</strong> 2014 for ages 15-19, Nati<strong>on</strong>al<br />
Survey <strong>of</strong> Demographic Dynamics (ENADID);<br />
2010, 2013 <strong>and</strong> 2016 for ages 10-14, Nati<strong>on</strong>al<br />
Populati<strong>on</strong> Council (CONAPO), <strong>of</strong>ficial)<br />
Paraguay (2008 <strong>and</strong> 2016, Demographic <strong>and</strong><br />
Health Surveys <strong>and</strong> MICS)<br />
Peru (2010, 2013 <strong>and</strong> 2016, Demographic <strong>and</strong><br />
Family Health Survey (ENDES))<br />
15-19 62.8 61.6 53.2<br />
10-14 2.2 2.5 1.9<br />
15-19 92; 116 (censo 2010) 90.0 89.0<br />
15-19 64.56; 102 (Censo 2010) 59.6 56.5<br />
15-19 89.0 74.0<br />
15-19 98.0 92.0<br />
15-19 101.0 74.0<br />
15-19 66.0 55.0<br />
15-19 69.5; 80.1 (censo 2010) 77.6<br />
10-14 1.7 1.9 2.2<br />
15-19 63.0 72.0<br />
15-19 68.0 65.0 61.0<br />
Uruguay (2010, 2013 <strong>and</strong> 2016, vital statistics) 15-19 59.9 60.9 50.3<br />
10-14 1.4 1.5 1.0<br />
Source: Ec<strong>on</strong>omic Commissi<strong>on</strong> for Latin America <strong>and</strong> <strong>the</strong> Caribbean (ECLAC), <strong>on</strong> <strong>the</strong> basis <strong>of</strong> United Nati<strong>on</strong>s, SDG Indicators Global Database [<strong>on</strong>line] https://unstats.<br />
un.org/sdgs/ <strong>and</strong> <strong>of</strong>ficial informati<strong>on</strong>, vital statistics submitted by <strong>the</strong> countries, Demographic <strong>and</strong> Health Surveys (DHS), surveys <strong>on</strong> sexual <strong>and</strong> reproductive<br />
health, Multiple Indicator Cluster Survey (MICS), Nati<strong>on</strong>al Survey <strong>of</strong> Demographic Dynamics (ENADID), Demographic <strong>and</strong> Family Health Surveys (ENDES) <strong>and</strong><br />
indirect estimati<strong>on</strong> <strong>of</strong> <strong>the</strong> 2010 census round.<br />
Note: According to <strong>the</strong> Mexican nati<strong>on</strong>al <str<strong>on</strong>g>report</str<strong>on</strong>g>, vital statistics show <strong>the</strong> fertility <strong>of</strong> <strong>the</strong> group aged 15 to 19 dropping from 76.5 per 1,000 in 2013 to 74.4 per 1,000 in 2015.<br />
49<br />
This increase was incentivized because <strong>the</strong> sexual activity that is <strong>on</strong> <strong>the</strong> increase tends to be prior to uni<strong>on</strong> (<strong>and</strong> much prior to marriage), <strong>and</strong> in <strong>the</strong> overwhelming majority<br />
<strong>of</strong> cases <strong>the</strong>re is no reproductive intent (Rodríguez, Di Cesare <strong>and</strong> Páez, 2017). The rise in sexual activity prior to uni<strong>on</strong> is deduced from <strong>the</strong> fact that while sexual activity<br />
in adolescence is becoming more frequent, uni<strong>on</strong> in adolescence is becoming a little less so. According to indicators B.12 <strong>of</strong> <strong>the</strong> M<strong>on</strong>tevideo C<strong>on</strong>sensus <strong>on</strong> Populati<strong>on</strong> <strong>and</strong><br />
<strong>Development</strong> <strong>and</strong> 5.3.1 <strong>of</strong> <strong>the</strong> SDGs for Latin America <strong>and</strong> <strong>the</strong> Caribbean, <strong>the</strong> proporti<strong>on</strong> <strong>of</strong> women in uni<strong>on</strong>s before <strong>the</strong> age <strong>of</strong> 15 fell from 7.67% in 2010 to 6.82% in 2015<br />
<strong>and</strong> <strong>the</strong> proporti<strong>on</strong> in uni<strong>on</strong>s before <strong>the</strong> age <strong>of</strong> 18 fell from 30.28% in 2010 to 28.88% in 2015 (see [<strong>on</strong>line] https://unstats.un.org/sdgs/indicators/database/?area=MDG_LAC).<br />
68


