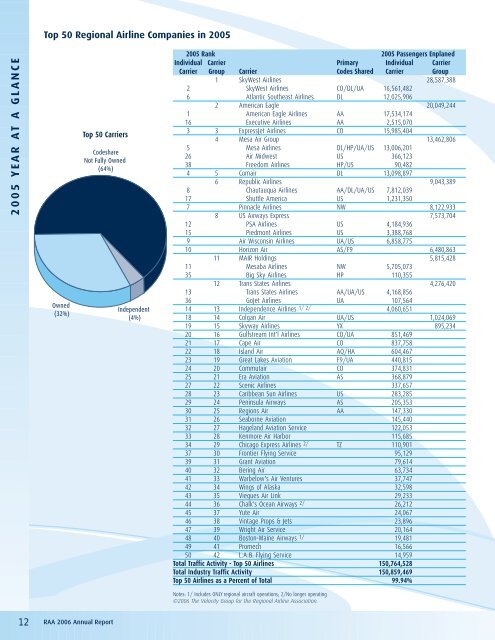
2005 YEAR AT A GLANCE 12 Top 50 <strong>Regional</strong> <strong>Airline</strong> Companies in 2005 Owned (32%) Top 50 Carriers Codeshare Not Fully Owned (64%) RAA 2006 Annual Report Independent (4%) 2005 Rank 2005 Passengers Enplaned Individual Carrier Primary Individual Carrier Carrier Group Carrier Codes Shared Carrier Group 1 SkyWest <strong>Airline</strong>s 28,587,388 2 SkyWest <strong>Airline</strong>s CO/DL/UA 16,561,482 6 Atlantic Southeast <strong>Airline</strong>s DL 12,025,906 2 American Eagle 20,049,244 1 American Eagle <strong>Airline</strong>s AA 17,534,174 16 Executive <strong>Airline</strong>s AA 2,515,070 3 3 ExpressJet <strong>Airline</strong>s CO 15,985,404 4 Mesa Air Group 13,462,806 5 Mesa <strong>Airline</strong>s DL/HP/UA/US 13,006,201 26 Air Midwest US 366,123 38 Freedom <strong>Airline</strong>s HP/US 90,482 4 5 Comair DL 13,098,897 6 Republic <strong>Airline</strong>s 9,043,389 8 Chautauqua <strong>Airline</strong>s AA/DL/UA/US 7,812,039 17 Shuttle America US 1,231,350 7 Pinnacle <strong>Airline</strong>s NW 8,122,933 8 US Airways Express 7,573,704 12 PSA <strong>Airline</strong>s US 4,184,936 15 Piedmont <strong>Airline</strong>s US 3,388,768 9 Air Wisconsin <strong>Airline</strong>s UA/US 6,858,775 10 Horizon Air AS/F9 6,480,863 11 MAIR Holdings 5,815,428 11 Mesaba <strong>Airline</strong>s NW 5,705,073 35 Big Sky <strong>Airline</strong>s HP 110,355 12 Trans States <strong>Airline</strong>s 4,276,420 13 Trans States <strong>Airline</strong>s AA/UA/US 4,168,856 36 GoJet <strong>Airline</strong>s UA 107,564 14 13 Independence <strong>Airline</strong>s 1/ 2/ 4,060,651 18 14 Colgan Air UA/US 1,024,069 19 15 Skyway <strong>Airline</strong>s YX 895,234 20 16 Gulfstream Int'l <strong>Airline</strong>s CO/UA 851,469 21 17 Cape Air CO 837,758 22 18 Island Air AQ/HA 604,467 23 19 Great Lakes Aviation F9/UA 440,815 24 20 Commutair CO 374,831 25 21 Era Aviation AS 368,879 27 22 Scenic <strong>Airline</strong>s 337,657 28 23 Caribbean Sun <strong>Airline</strong>s US 283,285 29 24 Peninsula Airways AS 205,353 30 25 Regions Air AA 147,330 31 26 Seaborne Aviation 145,440 32 27 Hageland Aviation Service 122,053 33 28 Kenmore Air Harbor 115,685 34 29 Chicago Express <strong>Airline</strong>s 2/ TZ 110,901 37 30 Frontier Flying Service 95,129 39 31 Grant Aviation 79,614 40 32 Bering Air 63,734 41 33 Warbelow's Air Ventures 37,747 42 34 Wings of Alaska 32,598 43 35 Vieques Air Link 29,233 44 36 Chalk's Ocean Airways 2/ 26,212 45 37 Yute Air 24,067 46 38 Vintage Props & Jets 23,896 47 39 Wright Air Service 20,164 48 40 Boston-Maine Airways 1/ 19,481 49 41 Promech 16,566 50 42 L.A.B. Flying Service 14,959 Total Traffic Activity - Top 50 <strong>Airline</strong>s 150,764,528 Total Industry Traffic Activity 150,859,469 Top 50 <strong>Airline</strong>s as a Percent of Total 99.94% Notes: 1/ Includes ONLY regional aircraft operations; 2/No longer operating ©2006 The Velocity Group for the <strong>Regional</strong> <strong>Airline</strong> <strong>Association</strong>.
Top 50 Individual <strong>Regional</strong> <strong>Airline</strong>s in 2005 2005 Passengers Departures Rank Enplaned RPMs ASMs Performed 1 American Eagle <strong>Airline</strong>s 17,534,174 7,501,486,112 10,523,749,579 540,440 2 SkyWest <strong>Airline</strong>s 16,561,482 7,630,725,424 10,147,697,932 524,407 3 ExpressJet <strong>Airline</strong>s 15,985,404 8,939,944,961" 11,975,558,198 450,093 4 Comair 13,098,897 6,147,133,929 9,029,656,282 387,858 5 Mesa <strong>Airline</strong>s 13,006,201 6,281,471,420 9,040,603,971 327,808 6 Atlantic Southeast <strong>Airline</strong>s 12,025,906 5,967,999,080 8,131,893,697 313,286 7 Pinnacle <strong>Airline</strong>s 8,122,933 4,137,376,467 5,759,716,446 248,046 8 Chautauqua <strong>Airline</strong>s 7,812,039 3,785,816,970 5,467,531,803 236,486 9 Air Wisconsin <strong>Airline</strong>s 6,858,775 2,727,763,835 3,688,728,842 172,644 10 Horizon Air 6,480,863 2,477,190,446 3,403,121,716 176,912 11 Mesaba <strong>Airline</strong>s 5,705,073 1,964,706,954 2,960,751,874 206,941 12 PSA <strong>Airline</strong>s 4,184,936 1,601,890,521 2,436,359,369 119,315 13 Trans States <strong>Airline</strong>s 4,168,856 1,706,862,250 2,458,163,108 139,203 14 Independence <strong>Airline</strong>s 1/ 2/ 4,060,651 1,495,602,973 2,295,640,978 121,308 15 Piedmont <strong>Airline</strong>s 3,388,768 629,291,758 1,173,611,881 158,143 16 Executive <strong>Airline</strong>s 2,515,070 554,216,586 907,235,204 66,589 17 Shuttle America 1,231,350 702,997,871 1,035,333,686 36,175 18 Colgan Air 1,024,069 203,168,283 486,890,800 86,933 19 Skyway <strong>Airline</strong>s 895,234 242,146,202 381,933,509 59,567 20 Gulfstream Int'l <strong>Airline</strong>s 851,469 166,635,542 288,954,721 71,273 21 Cape Air 837,758 56,824,168 105,757,343 149,213 22 Island Air 604,467 56,403,884 106,043,295 31,188 23 Great Lakes Aviation 440,815 117,159,691 279,355,460 59,999 24 Commutair 374,831 69,192,427 157,855,021 47,343 25 Era Aviation 368,879 49,439,453 92,771,481 33,417 26 Air Midwest 366,123 72,214,421 181,766,363 61,617 27 Scenic <strong>Airline</strong>s 337,657 51,676,733 69,518,211 25,480 28 Caribbean Sun <strong>Airline</strong>s 283,285 42,076,617 90,426,594 15,908 29 Peninsula Airways 205,353 90,386,662 167,391,917 46,128 30 Regions Air 147,330 22,004,958 55,882,002 19,671 31 Seaborne Aviation 145,440 6,788,666 8,300,645 12,943 32 Hageland Aviation Service 122,053 13,672,690 37,717,689 79,487 33 Kenmore Air Harbor 115,685 8,811,622 17,054,912 22,767 34 Chicago Express <strong>Airline</strong>s 2/ 110,901 19,052,778 36,191,674 6,381 35 Big Sky <strong>Airline</strong>s 110,355 36,739,186 70,768,407 20,709 36 GoJet <strong>Airline</strong>s 107,564 65,101,115 86,588,964 2,204 37 Frontier Flying Service 95,129 37,609,423 71,201,138 30,163 38 Freedom <strong>Airline</strong>s 90,482 58,029,019 80,539,784 2,555 39 Grant Aviation 79,614 9,737,676 23,901,482 44,958 40 Bering Air 63,734 9,198,364 26,412,399 32,757 41 Warbelow's Air Ventures 37,747 7,037,015 19,244,691 18,301 42 Wings of Alaska 32,598 1,917,044 4,246,808 12,629 43 Vieques Air Link 29,233 1,343,392 2,067,174 5,040 44 Chalk's Ocean Airways 2/ 26,212 3,940,470 5,463,579 2,212 45 Yute Air 24,067 1,471,104 3,805,803 14,647 46 Vintage Props & Jets 23,896 6,250,157 8,219,634 4,931 47 Wright Air Service 20,164 5,304,323 14,218,807 13,391 48 Boston-Maine Airways 1/ 19,481 7,922,137 21,231,235 4,600 49 Promech 16,566 1,734,630 3,497,284 15,915 50 L.A.B. Flying Service 14,959 1,029,847 3,600,760 13,049 Total Traffic Activity – Top 50 <strong>Airline</strong>s 150,764,528 65,794,497,255 93,444,174,152 5,293,030 Total Industry Traffic Activity 150,859,469 65,805,611,215 93,481,221,131 5,451,528 Top 50 <strong>Airline</strong>s as a Percent of Total 99.94% 99.98% 99.96% 97.09% Notes: 1/ Includes only regional aircraft operations; 2/ No longer operating. ©2006 The Velocity Group for the <strong>Regional</strong> <strong>Airline</strong> <strong>Association</strong>. Passenger Enplanements Top 20 <strong>Airline</strong>s (96%) Total Passengers 150,859,469 Other <strong>Airline</strong>s (4%) RAA 2006 Annual Report 13 2005 YEAR AT A GLANCE
- Page 2 and 3: Right size. Right cost. Right time.
- Page 4 and 5: 2 Table of Contents Report from the
- Page 6 and 7: RAA REGIONAL AIRLINE ASSOCIATION 4
- Page 8 and 9: 6 Thank you! to all of our 2006 spo
- Page 10 and 11: GE Aviation well traveled The CF34
- Page 12 and 13: 2005 YEAR AT A GLANCE 10 Year at a
- Page 16 and 17: 2005 YEAR AT A GLANCE 14 Regional P
- Page 18 and 19: 2005 YEAR AT A GLANCE 16 Regional A
- Page 20 and 21: REGIONAL AIRLINE SAFETY 18 Regional
- Page 22 and 23: AIRCRAFT 20 Aircraft In 2005 the nu
- Page 24 and 25: AIRCRAFT 22 Summary of Passenger Ai
- Page 26 and 27: ������ �����
- Page 28 and 29: FINANCIAL REVIEW 26 Regional Airlin
- Page 30 and 31: FINANCIAL REVIEW 28 regional jets (
- Page 32 and 33: FINANCIAL REVIEW 30 Conclusion The
- Page 34 and 35: INDUSTRY PROJECTIONS 32 Michael J.
- Page 36 and 37: INDUSTRY PROJECTIONS 34 spoke netwo
- Page 38 and 39: LABOR RELATIONS 36 Labor Relations
- Page 40 and 41: The tag that’s in demand. Since 1
- Page 42 and 43: AIRLINE DIRECTORY 40 Regional Aircr
- Page 44 and 45: AIRLINE DIRECTORY 42 Aero-Charter a
- Page 46 and 47: AIRLINE DIRECTORY 44 Bering Air, In
- Page 48 and 49: AIRLINE DIRECTORY 46 CSA Air, Inc.
- Page 50 and 51: AIRLINE DIRECTORY 48 Great Lakes Av
- Page 52 and 53: AIRLINE DIRECTORY 50 Mesa Airlines,
- Page 54 and 55: AIRLINE DIRECTORY 52 Rhoades Aviati
- Page 56 and 57: AIRLINE DIRECTORY 54 Transportation
- Page 59 and 60: Associate Member Directory Aircraft
- Page 61 and 62: Aircraft Interiors / Furnishings B/
- Page 63 and 64: Northwest Airlines 5101 Northwest D
- Page 65 and 66:
Sandel Avionics, Inc. 2401 Dogwood
- Page 67 and 68:
Flight Deck Resources, Inc. (cont
- Page 69 and 70:
Aero-Mach Labs, Inc. 7707 E. Funsto
- Page 71 and 72:
Aviatron, Inc. 25 Customs Drive Ric
- Page 73 and 74:
ExelTech (cont’d) Quebec City. Ex
- Page 75 and 76:
Liebherr-Aerospace Saline Co. 1465
- Page 77 and 78:
Pacific Propeller, International LL
- Page 79 and 80:
Saint-Gobain Performance Plastics C
- Page 81 and 82:
CAVOK International, Inc. 720 Whitl
- Page 83 and 84:
Ameron Global, Inc. (cont’d) Stat
- Page 85 and 86:
Matrix Aviation, Inc. 1701 South Ho
- Page 87 and 88:
GE - Aviation One Neumann Way Room
- Page 89 and 90:
Total Aviation Services, Inc. (cont
- Page 91 and 92:
Unitron, LP (cont’d) available in
- Page 93 and 94:
Paint and Markings Aviation Exterio
- Page 95 and 96:
Aeroxchange, Ltd. (cont’d) suppli
- Page 97 and 98:
LJK Companies, Inc. 10225 Yellow Ci
- Page 99 and 100:
3M Company . . . . . . . . . . . .
- Page 101 and 102:
Saywell International, Inc. . . . .
- Page 103 and 104:
Mark Your Calendar! The 2007 RAA An
- Page 105 and 106:
Services in North America RAA 2006
- Page 107 and 108:
Top-50 US Regional Carrier Airports
- Page 109 and 110:
Key to Airline Designators MAJOR AI
- Page 111 and 112:
Passenger Service in North America
- Page 113 and 114:
Passenger Service in North America
- Page 115 and 116:
Passenger Service in North America
- Page 117 and 118:
Passenger Service in North America
- Page 119 and 120:
Passenger Service in North America
- Page 121 and 122:
Essential Air Service RAA 2006 Annu
- Page 123 and 124:
act also directed DOT to use its ex
- Page 125 and 126:
Essential Air Service Section 419 C
- Page 127 and 128:
Annual State E.A.S. Point Subsidize
- Page 129 and 130:
Talent shows. One of the key issues