Right time. - Regional Airline Association
Right time. - Regional Airline Association
Right time. - Regional Airline Association

Create successful ePaper yourself
Turn your PDF publications into a flip-book with our unique Google optimized e-Paper software.
Europe. With new technology and high<br />
fuel costs, airlines in North America may<br />
be taking another look at the Bombardier<br />
product. We also believe that the traveling<br />
public will now be more receptive to this<br />
type of aircraft for shorter route segments.<br />
We believe that the industry will evolve<br />
into three or four strong regional carriers<br />
bidding for the business from multiple<br />
legacy carriers. Those that will win will be<br />
the best operators with the lowest cost<br />
structures and the best financial resources<br />
to sustain this growth and acquire aircraft.<br />
The major carriers, as they continue to try<br />
to cut costs and streamline operations, will<br />
become more dependant on the regionals<br />
and in all probability would rather contract<br />
this segment of the business out rather<br />
than operate it themselves for various<br />
reasons including the tieing up of<br />
resources and to gain the flexibility of<br />
changing operators if costs became too<br />
high. Nevertheless it will remain an important<br />
add-on to the legacy carriers systems<br />
in that they will need the important and<br />
frequent feed from smaller cities into their<br />
hubs to increase traffic flow over their<br />
longer distance routes that they will be<br />
flying themselves.<br />
As a result, some regional carriers will face<br />
uncertain growth prospects and we expect<br />
there will be a glut of 50-seat jets as larger<br />
aircraft come more into use. In the long<br />
run, we may be seeing the regional sector<br />
evolve into three or four large and wellcapitalized<br />
carriers; excluding AMR owned<br />
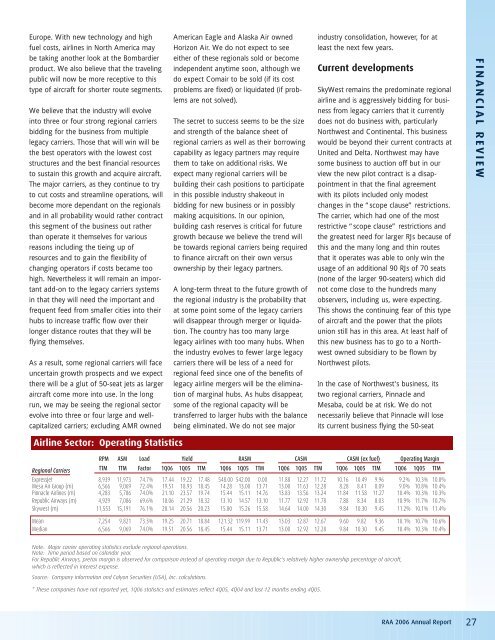
<strong>Airline</strong> Sector: Operating Statistics<br />
American Eagle and Alaska Air owned<br />
Horizon Air. We do not expect to see<br />
either of these regionals sold or become<br />
independent any<strong>time</strong> soon, although we<br />
do expect Comair to be sold (if its cost<br />
problems are fixed) or liquidated (if problems<br />
are not solved).<br />
The secret to success seems to be the size<br />
and strength of the balance sheet of<br />
regional carriers as well as their borrowing<br />
capability as legacy partners may require<br />
them to take on additional risks. We<br />
expect many regional carriers will be<br />
building their cash positions to participate<br />
in this possible industry shakeout in<br />
bidding for new business or in possibly<br />
making acquisitions. In our opinion,<br />
building cash reserves is critical for future<br />
growth because we believe the trend will<br />
be towards regional carriers being required<br />
to finance aircraft on their own versus<br />
ownership by their legacy partners.<br />
A long-term threat to the future growth of<br />
the regional industry is the probability that<br />
at some point some of the legacy carriers<br />
will disappear through merger or liquidation.<br />
The country has too many large<br />
legacy airlines with too many hubs. When<br />
the industry evolves to fewer large legacy<br />
carriers there will be less of a need for<br />
regional feed since one of the benefits of<br />
legacy airline mergers will be the elimination<br />
of marginal hubs. As hubs disappear,<br />
some of the regional capacity will be<br />
transferred to larger hubs with the balance<br />
being eliminated. We do not see major<br />
industry consolidation, however, for at<br />
least the next few years.<br />
Current developments<br />
SkyWest remains the predominate regional<br />
airline and is aggressively bidding for business<br />
from legacy carriers that it currently<br />
does not do business with, particularly<br />
Northwest and Continental. This business<br />
would be beyond their current contracts at<br />
United and Delta. Northwest may have<br />
some business to auction off but in our<br />
view the new pilot contract is a disappointment<br />
in that the final agreement<br />
with its pilots included only modest<br />
changes in the “scope clause” restrictions.<br />
The carrier, which had one of the most<br />
restrictive “scope clause” restrictions and<br />
the greatest need for larger RJs because of<br />
this and the many long and thin routes<br />
that it operates was able to only win the<br />
usage of an additional 90 RJs of 70 seats<br />
(none of the larger 90-seaters) which did<br />
not come close to the hundreds many<br />
observers, including us, were expecting.<br />
This shows the continuing fear of this type<br />
of aircraft and the power that the pilots<br />
union still has in this area. At least half of<br />
this new business has to go to a Northwest<br />
owned subsidiary to be flown by<br />
Northwest pilots.<br />
In the case of Northwest's business, its<br />
two regional carriers, Pinnacle and<br />
Mesaba, could be at risk. We do not<br />
necessarily believe that Pinnacle will lose<br />
its current business flying the 50-seat<br />
RPM ASM Load Yield RASM CASM CASM (ex fuel) Operating Margin<br />
<strong>Regional</strong> Carriers<br />
TTM TTM Factor 1Q06 1Q05 TTM 1Q06 1Q05 TTM 1Q06 1Q05 TTM 1Q06 1Q05 TTM 1Q06 1Q05 TTM<br />
ExpressJet 8,939 11,973 74.7% 17.44 19.22 17.48 548.00 542.00 0.00 11.88 12.27 11.72 10.16 10.49 9.96 9.2% 10.3% 10.0%<br />
Mesa Air Group (m) 6,566 9,069 72.4% 19.51 18.93 18.45 14.28 13.00 13.71 13.00 11.63 12.28 8.28 8.41 8.09 9.0% 10.8% 10.4%<br />
Pinnacle <strong>Airline</strong>s (m) 4,283 5,786 74.0% 21.10 23.57 19.74 15.44 15.11 14.76 13.83 13.56 13.24 11.84 11.58 11.27 10.4% 10.3% 10.3%<br />
Republic Airways (m) 4,929 7,086 69.6% 18.06 21.29 18.32 13.10 14.57 13.10 11.77 12.92 11.78 7.88 8.34 8.03 10.9% 11.7% 10.7%<br />
Skywest (m) 11,553 15,191 76.1% 20.14 20.56 20.23 15.80 15.26 15.58 14.64 14.00 14.30 9.84 10.30 9.45 11.2% 10.1% 11.4%<br />
Mean 7,254 9,821 73.3% 19.25 20.71 18.84 121.32 119.99 11.43 13.03 12.87 12.67 9.60 9.82 9.36 10.1% 10.7% 10.6%<br />
Median 6,566 9,069 74.0% 19.51 20.56 18.45 15.44 15.11 13.71 13.00 12.92 12.28 9.84 10.30 9.45 10.4% 10.3% 10.4%<br />
Note: Major carrier operating statistics exclude regional operations.<br />
Note: Time period based on calendar year.<br />
For Republic Airways, pretax margin is observed for comparison instead of operating margin due to Republic's relatively higher ownership percentage of aircraft,<br />
which is reflected in interest expense.<br />
Source: Company information and Calyon Securities (USA), Inc. calculations.<br />
* These companies have not reported yet, 1Q06 statistics and estimates reflect 4Q05, 4Q04 and last 12 months ending 4Q05.<br />
RAA 2006 Annual Report 27<br />
FINANCIAL REVIEW