Right time. - Regional Airline Association
Right time. - Regional Airline Association
Right time. - Regional Airline Association

Create successful ePaper yourself
Turn your PDF publications into a flip-book with our unique Google optimized e-Paper software.
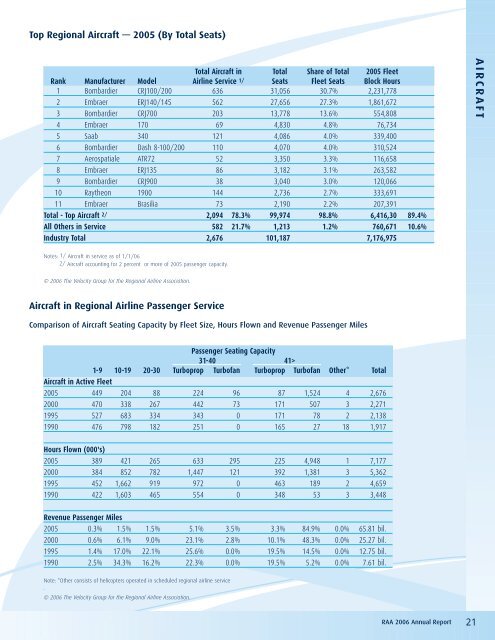
Top <strong>Regional</strong> Aircraft — 2005 (By Total Seats)<br />
Total Aircraft in Total Share of Total 2005 Fleet<br />
Rank Manufacturer Model <strong>Airline</strong> Service 1/ Seats Fleet Seats Block Hours<br />
1 Bombardier CRJ100/200 636 31,056 30.7% 2,231,778<br />
2 Embraer ERJ140/145 562 27,656 27.3% 1,861,672<br />
3 Bombardier CRJ700 203 13,778 13.6% 554,808<br />
4 Embraer 170 69 4,830 4.8% 76,734<br />
5 Saab 340 121 4,086 4.0% 339,400<br />
6 Bombardier Dash 8-100/200 110 4,070 4.0% 310,524<br />
7 Aerospatiale ATR72 52 3,350 3.3% 116,658<br />
8 Embraer ERJ135 86 3,182 3.1% 263,582<br />
9 Bombardier CRJ900 38 3,040 3.0% 120,066<br />
10 Raytheon 1900 144 2,736 2.7% 333,691<br />
11 Embraer Brasilia 73 2,190 2.2% 207,391<br />
Total - Top Aircraft 2/ 2,094 78.3% 99,974 98.8% 6,416,30 89.4%<br />
All Others in Service 582 21.7% 1,213 1.2% 760,671 10.6%<br />
Industry Total 2,676 101,187 7,176,975<br />
Notes: 1/ Aircraft in service as of 1/1/06<br />
2/ Aircraft accounting for 2 percent or more of 2005 passenger capacity.<br />
© 2006 The Velocity Group for the <strong>Regional</strong> <strong>Airline</strong> <strong>Association</strong>.<br />
Aircraft in <strong>Regional</strong> <strong>Airline</strong> Passenger Service<br />
Comparison of Aircraft Seating Capacity by Fleet Size, Hours Flown and Revenue Passenger Miles<br />
Passenger Seating Capacity<br />
31-40 41><br />
1-9 10-19 20-30 Turboprop Turbofan Turboprop Turbofan Other* Total<br />
Aircraft in Active Fleet<br />
2005 449 204 88 224 96 87 1,524 4 2,676<br />
2000 470 338 267 442 73 171 507 3 2,271<br />
1995 527 683 334 343 0 171 78 2 2,138<br />
1990 476 798 182 251 0 165 27 18 1,917<br />
Hours Flown (000's)<br />
2005 389 421 265 633 295 225 4,948 1 7,177<br />
2000 384 852 782 1,447 121 392 1,381 3 5,362<br />
1995 452 1,662 919 972 0 463 189 2 4,659<br />
1990 422 1,603 465 554 0 348 53 3 3,448<br />
Revenue Passenger Miles<br />
2005 0.3% 1.5% 1.5% 5.1% 3.5% 3.3% 84.9% 0.0% 65.81 bil.<br />
2000 0.6% 6.1% 9.0% 23.1% 2.8% 10.1% 48.3% 0.0% 25.27 bil.<br />
1995 1.4% 17.0% 22.1% 25.6% 0.0% 19.5% 14.5% 0.0% 12.75 bil.<br />
1990 2.5% 34.3% 16.2% 22.3% 0.0% 19.5% 5.2% 0.0% 7.61 bil.<br />
Note: *Other consists of helicopters operated in scheduled regional airline service<br />
.<br />
© 2006 The Velocity Group for the <strong>Regional</strong> <strong>Airline</strong> <strong>Association</strong>.<br />
RAA 2006 Annual Report 21<br />
AIRCRAFT