Right time. - Regional Airline Association
Right time. - Regional Airline Association
Right time. - Regional Airline Association

You also want an ePaper? Increase the reach of your titles
YUMPU automatically turns print PDFs into web optimized ePapers that Google loves.
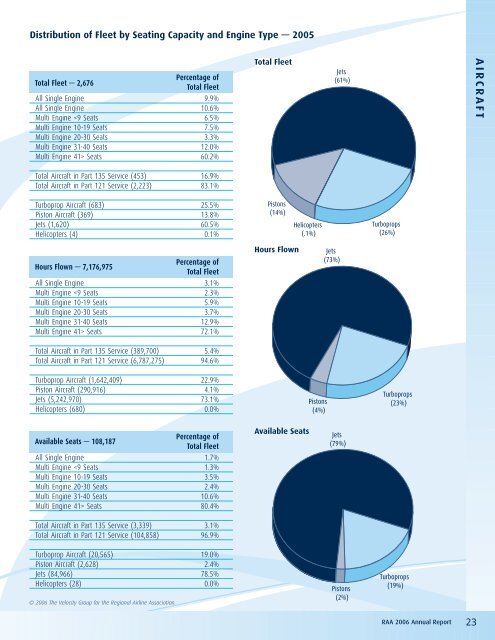
Distribution of Fleet by Seating Capacity and Engine Type — 2005<br />
Total Fleet — 2,676<br />
Percentage of<br />
Total Fleet<br />
All Single Engine 9.9%<br />
All Single Engine 10.6%<br />
Multi Engine Seats 60.2%<br />
Total Aircraft in Part 135 Service (453) 16.9%<br />
Total Aircraft in Part 121 Service (2,223) 83.1%<br />
Turboprop Aircraft (683) 25.5%<br />
Piston Aircraft (369) 13.8%<br />
Jets (1,620) 60.5%<br />
Helicopters (4) 0.1%<br />
Hours Flown — 7,176,975<br />
Percentage of<br />
Total Fleet<br />
All Single Engine 3.1%<br />
Multi Engine Seats 72.1%<br />
Total Aircraft in Part 135 Service (389,700) 5.4%<br />
Total Aircraft in Part 121 Service (6,787,275) 94.6%<br />
Turboprop Aircraft (1,642,409) 22.9%<br />
Piston Aircraft (290,916) 4.1%<br />
Jets (5,242,970) 73.1%<br />
Helicopters (680) 0.0%<br />
Available Seats — 108,187<br />
Percentage of<br />
Total Fleet<br />
All Single Engine 1.7%<br />
Multi Engine Seats 80.4%<br />
Total Aircraft in Part 135 Service (3,339) 3.1%<br />
Total Aircraft in Part 121 Service (104,858) 96.9%<br />
Turboprop Aircraft (20,565) 19.0%<br />
Piston Aircraft (2,628) 2.4%<br />
Jets (84,966) 78.5%<br />
Helicopters (28) 0.0%<br />
© 2006 The Velocity Group for the <strong>Regional</strong> <strong>Airline</strong> <strong>Association</strong>.<br />
Total Fleet<br />
Pistons<br />
(14%)<br />
Hours Flown<br />
Helicopters<br />
(.1%)<br />
Available Seats<br />
Pistons<br />
(4%)<br />
Jets<br />
(73%)<br />
Jets<br />
(61%)<br />
Jets<br />
(79%)<br />
Pistons<br />
(2%)<br />
Turboprops<br />
(26%)<br />
Turboprops<br />
(23%)<br />
Turboprops<br />
(19%)<br />
RAA 2006 Annual Report 23<br />
AIRCRAFT