Annual Report 2006 ISS Global A/S
Annual Report 2006 ISS Global A/S
Annual Report 2006 ISS Global A/S

You also want an ePaper? Increase the reach of your titles
YUMPU automatically turns print PDFs into web optimized ePapers that Google loves.
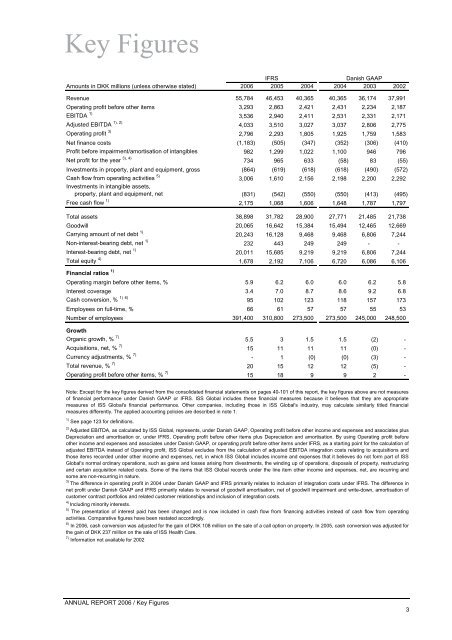
Key Figures<br />
Amounts in DKK millions (unless otherwise stated) <strong>2006</strong><br />
Revenue 55,784<br />
Operating profit before other items 3,293<br />
EBITDA 1)<br />
3,536<br />
1), 2)<br />
Adjusted EBITDA 4,033<br />
Operating profit 3)<br />
2,796<br />
Net finance costs (1,183)<br />
Profit before impairment/amortisation of intangibles 982<br />
3), 4)<br />
Net profit for the year 734<br />
Investments in property, plant and equipment, gross (864)<br />
Cash flow from operating activities 5)<br />
Investments in intangible assets,<br />
3,006<br />
property, plant and equipment, net (831)<br />
Free cash flow 1)<br />
2,175<br />
Total assets 38,898<br />
Goodwill 20,065<br />
Carrying amount of net debt 1)<br />
20,243<br />
Non-interest-bearing debt, net 1)<br />
232<br />
Interest-bearing debt, net 1)<br />
20,011<br />
Total equity 4)<br />
Financial ratios<br />
1,678<br />
1)<br />
Operating margin before other items, % 5.9<br />
Interest coverage 3.4<br />
1) 6)<br />
Cash conversion, % 95<br />
Employees on full-time, % 66<br />
Number of employees 391,400<br />
Growth<br />
Organic growth, % 7)<br />
Acquisitions, net, % 7)<br />
Currency adjustments, % 7)<br />
Total revenue, % 7)<br />
Operating profit before other items, % 7)<br />
1) See page 123 for definitions.<br />
ANNUAL REPORT <strong>2006</strong> / Key Figures<br />
5.5<br />
15<br />
-<br />
20<br />
15<br />
IFRS<br />
2005<br />
46,453<br />
2,863<br />
2,940<br />
3,510<br />
2,293<br />
(505)<br />
1,299<br />
965<br />
(619)<br />
1,610<br />
(542)<br />
1,068<br />
31,782<br />
16,642<br />
16,128<br />
443<br />
15,685<br />
2,192<br />
6.2<br />
7.0<br />
102<br />
61<br />
310,800<br />
3<br />
11<br />
1<br />
15<br />
18<br />
2004<br />
40,365<br />
2,421<br />
2,411<br />
3,027<br />
1,805<br />
(347)<br />
1,022<br />
633<br />
(618)<br />
2,156<br />
(550)<br />
1,606<br />
28,900<br />
15,384<br />
9,468<br />
249<br />
9,219<br />
7,106<br />
6.0<br />
8.7<br />
123<br />
57<br />
273,500<br />
1.5<br />
11<br />
(0)<br />
12<br />
9<br />
Danish GAAP<br />
2004 2003<br />
40,365<br />
2,431<br />
2,531<br />
3,037<br />
1,925<br />
(352)<br />
1,100<br />
(58)<br />
(618)<br />
2,198<br />
(550)<br />
1,648<br />
27,771<br />
15,494<br />
9,468<br />
249<br />
9,219<br />
6,720<br />
6.0<br />
8.6<br />
118<br />
57<br />
273,500<br />
1.5<br />
11<br />
(0)<br />
12<br />
9<br />
36,174<br />
2,234<br />
2,331<br />
2,806<br />
1,759<br />
(306)<br />
946<br />
83<br />
(490)<br />
2,200<br />
(413)<br />
1,787<br />
21,485<br />
12,465<br />
6,806<br />
-<br />
6,806<br />
6,086<br />
6.2<br />
9.2<br />
157<br />
55<br />
245,000<br />
(2)<br />
(0)<br />
(3)<br />
(5)<br />
2<br />
2002<br />
37,991<br />
2,187<br />
2,171<br />
2,775<br />
1,583<br />
(410)<br />
796<br />
(55)<br />
(572)<br />
2,292<br />
(495)<br />
1,797<br />
21,738<br />
12,669<br />
7,244<br />
-<br />
7,244<br />
6,106<br />
5.8<br />
6.8<br />
173<br />
53<br />
248,500<br />
Note: Except for the key figures derived from the consolidated financial statements on pages 40-101 of this report, the key figures above are not measures<br />
of financial performance under Danish GAAP or IFRS. <strong>ISS</strong> <strong>Global</strong> includes these financial measures because it believes that they are appropriate<br />
measures of <strong>ISS</strong> <strong>Global</strong>'s financial performance. Other companies, including those in <strong>ISS</strong> <strong>Global</strong>'s industry, may calculate similarly titled financial<br />
measures differently. The applied accounting policies are described in note 1.<br />
2)<br />
Adjusted EBITDA, as calculated by <strong>ISS</strong> <strong>Global</strong>, represents, under Danish GAAP, Operating profit before other income and expenses and associates plus<br />
Depreciation and amortisation or, under IFRS, Operating profit before other items plus Depreciation and amortisation. By using Operating profit before<br />
other income and expenses and associates under Danish GAAP, or operating profit before other items under IFRS, as a starting point for the calculation of<br />
adjusted EBITDA instead of Operating profit, <strong>ISS</strong> <strong>Global</strong> excludes from the calculation of adjusted EBITDA integration costs relating to acquisitions and<br />
those items recorded under other income and expenses, net, in which <strong>ISS</strong> <strong>Global</strong> includes income and expenses that it believes do not form part of <strong>ISS</strong><br />
<strong>Global</strong>'s normal ordinary operations, such as gains and losses arising from divestments, the winding up of operations, disposals of property, restructuring<br />
and certain acquisition related costs. Some of the items that <strong>ISS</strong> <strong>Global</strong> records under the line item other income and expenses, net, are recurring and<br />
some are non-recurring in nature.<br />
3)<br />
The difference in operating profit in 2004 under Danish GAAP and IFRS primarily relates to inclusion of integration costs under IFRS. The difference in<br />
net profit under Danish GAAP and IFRS primarily relates to reversal of goodwill amortisation, net of goodwill impairment and write-down, amortisation of<br />
customer contract portfolios and related customer relationships and inclusion of integration costs.<br />
4)<br />
Including minority interests.<br />
5)<br />
The presentation of interest paid has been changed and is now included in cash flow from financing activities instead of cash flow from operating<br />
activities. Comparative figures have been restated accordingly.<br />
6)<br />
In <strong>2006</strong>, cash conversion was adjusted for the gain of DKK 108 million on the sale of a call option on property. In 2005, cash conversion was adjusted for<br />
the gain of DKK 237 million on the sale of <strong>ISS</strong> Health Care.<br />
7)<br />
Information not available for 2002<br />
-<br />
-<br />
-<br />
-<br />
-<br />
3