Annual Report 2006 ISS Global A/S
Annual Report 2006 ISS Global A/S
Annual Report 2006 ISS Global A/S

Create successful ePaper yourself
Turn your PDF publications into a flip-book with our unique Google optimized e-Paper software.
NOTES TO THE CONSOLIDATED FINANCIAL STATEMENTS<br />
1 January – 31 December. Amounts in DKK millions<br />
15. Impairment tests (continued)<br />
Estimates used to measure recoverable amount<br />
The recoverable amount of each CGU is determined on the basis of its value-in-use. The value-in-use is established using certain key<br />
assumptions as described below. The key assumptions are turnover growth, operating margin and discount rates.<br />
Value-in-use cash flow projections are based on financial budgets approved by management covering the following financial year. The<br />
operating margin is based on past performance and expectations for the future market development. The assumptions applied in the<br />
short to medium term are based on management's expectations regarding the development in growth and operating margin. The<br />
terminal growth rates do not exceed the expected long-term average growth rate including inflation for the business in which the<br />
CGU's operate.<br />
Uncertainties reflecting historical performance and possible variations in the amount or timing of the future cash flow is reflected in the<br />
discount rate.<br />
In determining the country specific discount rates, which are calculated net of tax, a target ratio of 75/25 between the market value of<br />
debt and enterprise value is used. A country specific risk premium has been added to the discount rates to reflect the specific risk<br />
associated with each CGU.<br />
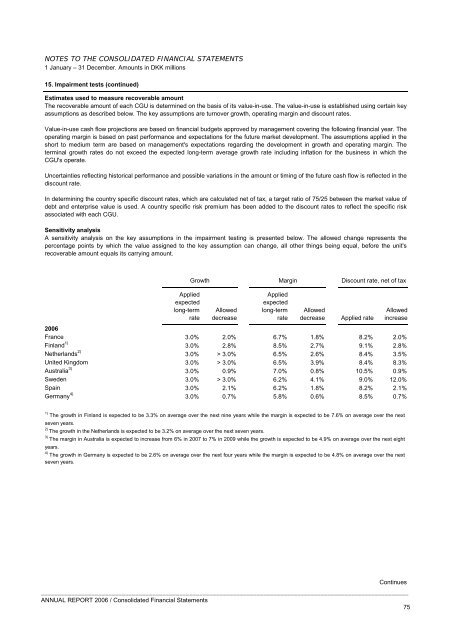
Sensitivity analysis<br />
A sensitivity analysis on the key assumptions in the impairment testing is presented below. The allowed change represents the<br />
percentage points by which the value assigned to the key assumption can change, all other things being equal, before the unit's<br />
recoverable amount equals its carrying amount.<br />
Growth<br />
Applied<br />
expected<br />
long-term<br />
rate<br />
Allowed<br />
decrease<br />
Applied<br />
expected<br />
long-term<br />
rate<br />
Discount rate, net of tax<br />
Allowed<br />
decrease Applied rate<br />
Allowed<br />
increase<br />
<strong>2006</strong><br />
France 3.0% 2.0% 6.7% 1.8% 8.2% 2.0%<br />
Finland 1)<br />
3.0% 2.8% 8.5% 2.7% 9.1% 2.8%<br />
Netherlands 2)<br />
3.0% > 3.0% 6.5% 2.6% 8.4% 3.5%<br />
United Kingdom 3.0% > 3.0% 6.5% 3.9% 8.4% 8.3%<br />
Australia 3)<br />
3.0% 0.9% 7.0% 0.8% 10.5% 0.9%<br />
Sweden 3.0% > 3.0% 6.2% 4.1% 9.0% 12.0%<br />
Spain 3.0% 2.1% 6.2% 1.8% 8.2% 2.1%<br />
Germany 4)<br />
3.0% 0.7% 5.8% 0.6% 8.5% 0.7%<br />
Continues<br />
_____________________________________________________________________________________________________________<br />
ANNUAL REPORT <strong>2006</strong> / Consolidated Financial Statements<br />
75<br />
Margin<br />
1)<br />
The growth in Finland is expected to be 3.3% on average over the next nine years while the margin is expected to be 7.6% on average over the next<br />
seven years.<br />
2)<br />
The growth in the Netherlands is expected to be 3.2% on average over the next seven years.<br />
3)<br />
The margin in Australia is expected to increase from 6% in 2007 to 7% in 2009 while the growth is expected to be 4.9% on average over the next eight<br />
years.<br />
4)<br />
The growth in Germany is expected to be 2.6% on average over the next four years while the margin is expected to be 4.8% on average over the next<br />
seven years.