

Thesis

Create successful ePaper yourself
Turn your PDF publications into a flip-book with our unique Google optimized e-Paper software.
Results 87<br />
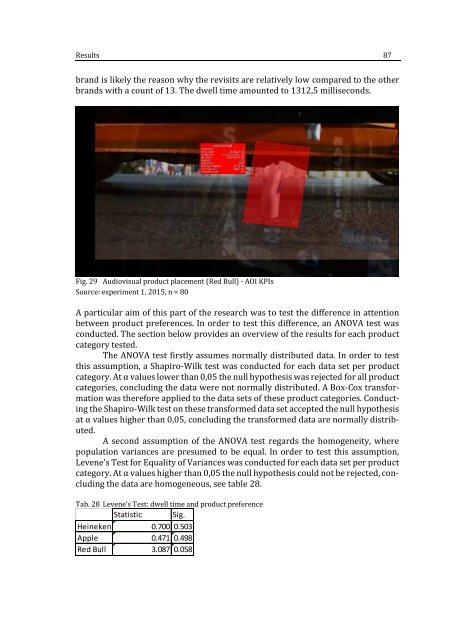
brand is likely the reason why the revisits are relatively low compared to the other<br />
brands with a count of 13. The dwell time amounted to 1312,5 milliseconds.<br />
Fig. 29 Audiovisual product placement (Red Bull) - AOI KPIs<br />
Source: experiment 1, 2015, n = 80<br />
A particular aim of this part of the research was to test the difference in attention<br />
between product preferences. In order to test this difference, an ANOVA test was<br />
conducted. The section below provides an overview of the results for each product<br />
category tested.<br />
The ANOVA test firstly assumes normally distributed data. In order to test<br />
this assumption, a Shapiro-Wilk test was conducted for each data set per product<br />
category. At α values lower than , the null hypothesis was rejected for all product<br />
categories, concluding the data were not normally distributed. A Box-Cox transformation<br />
was therefore applied to the data sets of these product categories. Conducting<br />
the Shapiro-Wilk test on these transformed data set accepted the null hypothesis<br />
at α values higher than ,, concluding the transformed data are normally distributed.<br />
A second assumption of the ANOVA test regards the homogeneity, where<br />
population variances are presumed to be equal. In order to test this assumption,<br />
Levenes Test for Equality of Variances was conducted for each data set per product<br />
category. At α values higher than , the null hypothesis could not be rejected, concluding<br />
the data are homogeneous, see table 28.<br />
Tab. 28 Levenes Test: dwell time and product preference<br />
Statistic Sig.<br />
Heineken 0.700 0.503<br />
Apple 0.471 0.498<br />
Red Bull 3.087 0.058