IATSE 3rd 2019_web

You also want an ePaper? Increase the reach of your titles
YUMPU automatically turns print PDFs into web optimized ePapers that Google loves.
Recent accounting pronouncements<br />
In August 2016, the Financial Accounting Standards Board (FASB) issued Accounting<br />
Standards Update 2016-14, Not-for-Profit Entities (Topic 958) – Presentation of Financial<br />
Statements of Not-for-Profit Entities (“ASU 2016-14”). Effective for financial statements<br />
with fiscal years beginning after December 15, 2017, ASU 2016-14 addresses the<br />
understandability of net asset classification, information about liquidity and availability of<br />
resources, and the lack of consistency in the type of information provided about expenses<br />
and investment return. The International has adjusted the presentation of the financial<br />
statements accordingly. ASU 2016-14 has been applied retrospectively to all periods<br />
presented.<br />
Note 2 - Cash<br />
<strong>2019</strong> 2018<br />
Interest bearing $2,358,234 $1,962,543<br />
Non-interest bearing 756,681 1,136,306<br />
Total $ 3,114,915 $3,098,849<br />
At times throughout the years the International may have, on deposit in banks, amounts<br />
in excess of FDIC insurance limits. The International has not experienced any losses in such<br />
accounts and the Officers believe it is not exposed to any significant credit risks.<br />
Note 3 - Investments<br />
Investments consist of the following:<br />
<strong>2019</strong> 2018<br />
Certificates of deposit $ 4,627,997 $ 3,671,473<br />
Government securities 25,821,054 24,796,173<br />
Corporate debt instruments 9,480,048 8,376,547<br />
Registered investment companies 10,334,894 7,753,142<br />
Non-publicly traded stock 118,554 103,441<br />
Total $50,382,547 $44,700,776<br />
Investment income (loss) consists of the following:<br />
<strong>2019</strong> 2018<br />
Interest and dividends $943,451 $ 610,813<br />
Net appreciation (depreciation)in fair value 618,695 (1,493,074)<br />
Currency translation gain (loss) (545,852) 822,502<br />
Less: investment expenses ( 203,217) ( 183,271)<br />
Total $813,077 $(243,030)<br />
Note 4 - Board designated investments<br />
In July 2001, the General Executive Board authorized the allocation of funds from the<br />
General Fund to a building reserve. The building reserve is used to offset costs associated<br />
with purchasing new buildings or maintaining the International’s existing buildings. The<br />
total amount transferred into the building reserve for the years ended April 30, <strong>2019</strong> and<br />
2018 was $1,244,655 and $1,140,135, respectively. The fair value of the International’s<br />
investment in the building reserve as of April 30, <strong>2019</strong> and 2018 was $3,701,512 and<br />
$2,428,117, respectively. This amount is included in the investments at fair value in the<br />
combined statements of financial position. On May 2, 2017, $3,000,000 was withdrawn from<br />
the building reserve and transferred to the Realty Corp. for the purchase of a new building.<br />
Note 5 - Fair value measurements<br />
The framework for measuring fair value provides a fair value hierarchy that prioritizes the<br />
inputs to valuation techniques used to measure fair value. The hierarchy gives the highest<br />
priority to unadjusted quoted prices in active markets for identical assets or liabilities (level<br />
1 measurements) and the lowest priority to unobservable inputs (level 3 measurements).<br />
The three levels of the fair value hierarchy under FASB ASC 820 are described as follows:<br />
Level 1 inputs to the valuation methodology are unadjusted quoted prices, in active<br />
markets, for identical assets that the International has the ability to access.<br />
Level 2 inputs to the valuation methodology include: quoted prices for similar assets in<br />
active markets, quoted prices for identical or similar assets in inactive markets, inputs other<br />
than quoted prices that are observable for the asset, and inputs that are derived principally<br />
from or corroborated by observable market data by correlation or other means. If the asset<br />
has a specified (contractual) term, the level 2 input must be observable for substantially<br />
the full term of the asset.<br />
Level 3 inputs to the valuation methodology are unobservable and significant to the fair<br />
value measurement. Level 3 inputs are generally based on the best information available<br />
which may include the reporting entity’s own assumptions and data.<br />
The asset’s fair value measurement level within the fair value hierarchy is based on<br />
the lowest level of any input that is significant to the fair value measurement. Valuation<br />
techniques used need to maximize the use of observable inputs and minimize the use of<br />
unobservable inputs.<br />
Certificates of deposit, government securities, corporate debt instruments and registered<br />
investment companies: Valued at the closing price reported in the active market in which<br />
the securities are traded.<br />
Non-publicly traded stock: Valued at the closing net asset value of shares as reported by<br />
independent third party valuation.<br />
The preceding methods may produce a fair value calculation that may not be indicative of<br />
net realizable value or reflective of future fair values. Furthermore, although the International<br />
believes its valuation methods are appropriate and consistent with other market participants,<br />
the use of different methodologies or assumptions to determine the fair value of certain<br />
financial instruments could result in a different fair value measurement at the reporting<br />
date.<br />
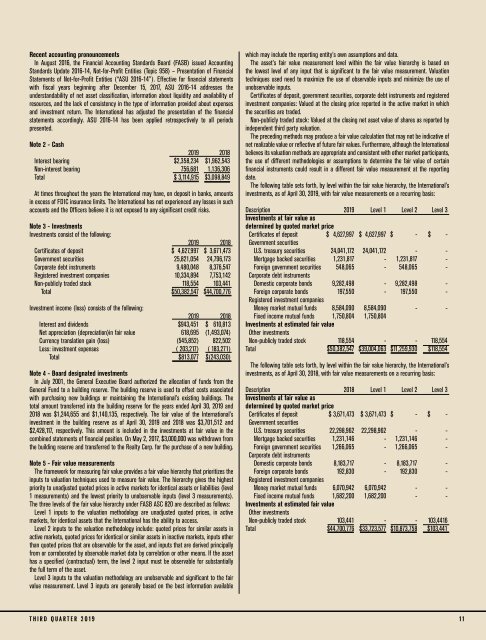
The following table sets forth, by level within the fair value hierarchy, the International’s<br />
investments, as of April 30, <strong>2019</strong>, with fair value measurements on a recurring basis:<br />
Description <strong>2019</strong> Level 1 Level 2 Level 3<br />
Investments at fair value as<br />
determined by quoted market price<br />
Certificates of deposit $ 4,627,997 $ 4,627,997 $ - $ -<br />
Government securities<br />
U.S. treasury securities 24,041,172 24,041,172 - -<br />
Mortgage backed securities 1,231,817 - 1,231,817 -<br />
Foreign government securities 548,065 - 548,065 -<br />
Corporate debt instruments<br />
Domestic corporate bonds 9,282,498 - 9,282,498 -<br />
Foreign corporate bonds 197,550 - 197,550 -<br />
Registered investment companies<br />
Money market mutual funds 8,584,090 8,584,090 - -<br />
Fixed income mutual funds 1,750,804 1,750,804<br />
Investments at estimated fair value<br />
Other investments<br />
Non-publicly traded stock 118,554 - - 118,554<br />
Total $50,382,547 $39,004,063 $11,259,930 $118,554<br />
The following table sets forth, by level within the fair value hierarchy, the International’s<br />
investments, as of April 30, 2018, with fair value measurements on a recurring basis:<br />
Description 2018 Level 1 Level 2 Level 3<br />
Investments at fair value as<br />
determined by quoted market price<br />
Certificates of deposit $ 3,671,473 $ 3,671,473 $ - $ -<br />
Government securities<br />
U.S. treasury securities 22,298,962 22,298,962 - -<br />
Mortgage backed securities 1,231,146 - 1,231,146 -<br />
Foreign government securities 1,266,065 - 1,266,065 -<br />
Corporate debt instruments<br />
Domestic corporate bonds 8,183,717 - 8,183,717 -<br />
Foreign corporate bonds 192,830 - 192,830 -<br />
Registered investment companies<br />
Money market mutual funds 6,070,942 6,070,942 - -<br />
Fixed income mutual funds 1,682,200 1,682,200 - -<br />
Investments at estimated fair value<br />
Other investments<br />
Non-publicly traded stock 103,441 - - 103,4416<br />
Total $44,700,776 $33,723,577 $10,873,758 $103,441<br />
THIRD QUARTER <strong>2019</strong> 11