Linking Restoration and Ecological Succession (Springer ... - Inecol
Linking Restoration and Ecological Succession (Springer ... - Inecol
Linking Restoration and Ecological Succession (Springer ... - Inecol

You also want an ePaper? Increase the reach of your titles
YUMPU automatically turns print PDFs into web optimized ePapers that Google loves.
100 Joachim Schrautzer et al.<br />
Species number/plot<br />
Species number/plot<br />
60<br />
50<br />
40<br />
30<br />
20<br />
10<br />
0<br />
60<br />
50<br />
40<br />
30<br />
20<br />
10<br />
0<br />
F = 7.17<br />
p < 0.001<br />
a<br />
b<br />
c<br />
d<br />
1 A 1 B 2 A 2 B 3 4 A 4 B 5<br />
a<br />
a<br />
L<strong>and</strong>-use intensification sere F = 3.76<br />
Ab<strong>and</strong>onment: Sere A<br />
a<br />
p < 0.001<br />
b<br />
Ab<strong>and</strong>onment: Sere B<br />
I II III<br />
IV<br />
b<br />
b<br />
c<br />
F = 3.92<br />
p < 0.001<br />
b<br />
a<br />
F = 3.28<br />
p < 0.001<br />
b<br />
I II III<br />
IV<br />
a<br />
a<br />
c<br />
Ab<strong>and</strong>onment: Sere C<br />
I II III<br />
IV<br />
<strong>Succession</strong>al stage <strong>Succession</strong>al stage<br />
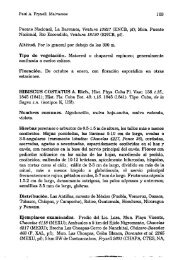
Figure 5.4 Change of species richness in the l<strong>and</strong>-use intensification (stages 1A to 5, see Fig 5.1) <strong>and</strong> in stages<br />
I–IV for ab<strong>and</strong>onment seres A, B <strong>and</strong> C. Plot size of alder carrs c. 100 m 2 <strong>and</strong> of types with herbaceous vegetation<br />
c. 16–25 m 2 . Medians, 25 <strong>and</strong> 75% percentiles , <strong>and</strong> ranges without outliers (horizontal lines) are shown. Kruskal-<br />
Wallis-test (F <strong>and</strong> p) results are also shown. Different letters show significant differences (p < 0.05, Median test)<br />
across stages.<br />
As a generalization across the retrogressive succession from alder carrs to wet<br />
pastures, C-balances progressively dropped; efficiency measures (NPP/MSR<br />
<strong>and</strong> NPP/Transpiration) also dropped but not as consistently as C-balances.<br />
Measures of N, hydrological budgets, <strong>and</strong> energy budgets started high (1A <strong>and</strong><br />
1B), then dropped (2A, 2B <strong>and</strong> 3), then rose again (4A, 4B <strong>and</strong> 5).<br />
Table 5.5 Simulation results (WASMOD) for nitrogen <strong>and</strong> carbon budgets parameters, <strong>and</strong> efficiency<br />
measures in stages of the l<strong>and</strong> use intensification sere. Ecosystem types are from Fig. 5.1.<br />
Ecosystem types<br />
Indicator: 1A 1B 2A 2B 3 4A 4B 5<br />
NNM (kg N ha −1 a −1 ) 38 56 14 27 11 28 84 125<br />
N-Leaching (kg N ha −1 a −1 ) −15 −18 −9 −12 −6 −13 −46 −64<br />
Denitr. (kg N ha −1 a −1 ) 17 29 3 7 3 12 52 100<br />
N-balance (kg N ha −1 a −1 ) −8 −23 3 −2 −4 −16 −24 −35<br />
NPP (kg C ha −1 a −1 )* 10 3 4.8 6.0 2.9 4 1 2.1 3.0 3.5<br />
C-balance (kg C ha −1 a −1 )* 10 3 +2 0 −0.6 +0.4 −1.3 −1.2 −5.6 −7.3<br />
NPP/MSR 1.8 1.4 0.8 1.1 0.6 0.9 0.5 0.6<br />
NPP/Transpiration 422 516 300 377 94 209 284 350<br />
b<br />
b<br />
a