ANNUAL REPORT 2011 - Kuehne + Nagel
ANNUAL REPORT 2011 - Kuehne + Nagel
ANNUAL REPORT 2011 - Kuehne + Nagel

You also want an ePaper? Increase the reach of your titles
YUMPU automatically turns print PDFs into web optimized ePapers that Google loves.
72<br />
Consolidated Financial Statements <strong>2011</strong> _ _ _ _ _ _ Other Notes<br />
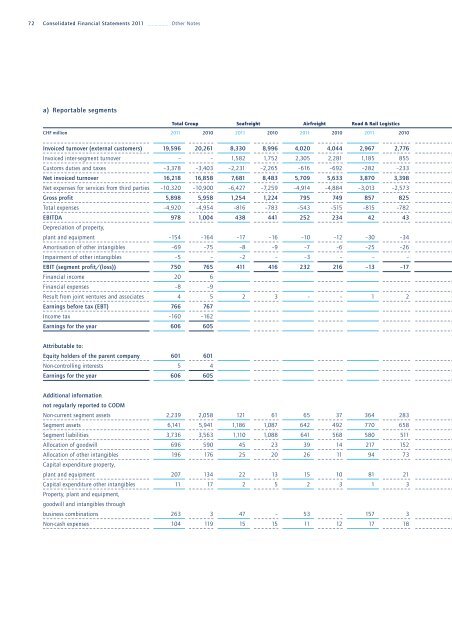
a) Reportable segments<br />
Total Group Seafreight Airfreight Road & Rail Logistics<br />
CHF million <strong>2011</strong> 2010 <strong>2011</strong> 2010 <strong>2011</strong> 2010 <strong>2011</strong> 2010<br />
Invoiced turnover (external customers) 19,596 20,261 8,330 8,996 4,020 4,044 2,967 2,776<br />
Invoiced inter-segment turnover – – 1,582 1,752 2,305 2,281 1,185 855<br />
Customs duties and taxes –3,378 –3,403 –2,231 –2,265 –616 –692 –282 –233<br />
Net invoiced turnover 16,218 16,858 7,681 8,483 5,709 5,633 3,870 3,398<br />
Net expenses for services from third parties –10,320 –10,900 –6,427 –7,259 –4,914 –4,884 –3,013 –2,573<br />
Gross profit 5,898 5,958 1,254 1,224 795 749 857 825<br />
Total expenses –4,920 –4,954 –816 –783 –543 –515 –815 –782<br />
EBITDA<br />
Depreciation of property,<br />
978 1,004 438 441 252 234 42 43<br />
plant and equipment –154 –164 –17 –16 –10 –12 –30 –34<br />
Amortisation of other intangibles –69 –75 –8 –9 –7 –6 –25 –26<br />
Impairment of other intangibles –5 – –2 – –3 – – –<br />
EBIT (segment profit/(loss)) 750 765 411 416 232 216 –13 –17<br />
Financial income 20 6<br />
Financial expenses –8 –9<br />
Result from joint ventures and associates 4 5 2 3 – – 1 2<br />
Earnings before tax (EBT) 766 767<br />
Income tax –160 –162<br />
Earnings for the year 606 605<br />
Attributable to:<br />
Equity holders of the parent company 601 601<br />
Non-controlling interests 5 4<br />
Earnings for the year 606 605<br />
Additional information<br />
not regularly reported to CODM<br />
Non-current segment assets 2,239 2,058 121 61 65 37 364 283<br />
Segment assets 6,141 5,941 1,186 1,087 642 492 770 658<br />
Segment liabilities 3,736 3,563 1,110 1,088 641 568 580 511<br />
Allocation of goodwill 696 590 45 23 39 14 217 152<br />
Allocation of other intangibles<br />
Capital expenditure property,<br />
196 176 25 20 26 11 94 73<br />
plant and equipment 207 134 22 13 15 10 81 21<br />
Capital expenditure other intangibles<br />
Property, plant and equipment,<br />
goodwill and intangibles through<br />
11 17 2 5 2 3 1 3<br />
business combinations 263 3 47 – 53 – 157 3<br />
Non-cash expenses 104 119 15 15 11 12 17 18