Usability of Digital Cameras for Verifying Physically Based ...
Usability of Digital Cameras for Verifying Physically Based ...
Usability of Digital Cameras for Verifying Physically Based ...

Create successful ePaper yourself
Turn your PDF publications into a flip-book with our unique Google optimized e-Paper software.
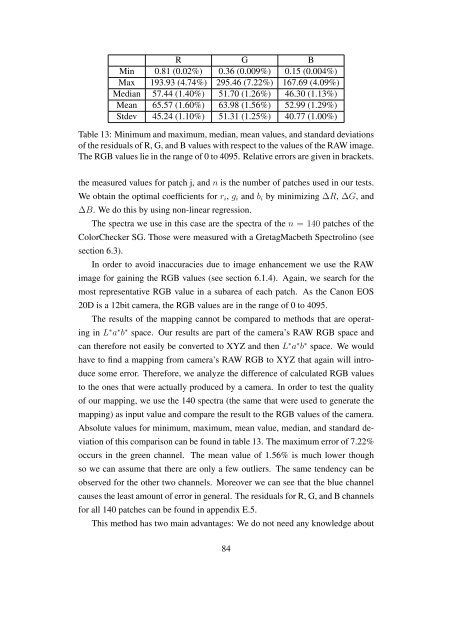
R G B<br />
Min 0.81 (0.02%) 0.36 (0.009%) 0.15 (0.004%)<br />
Max 193.93 (4.74%) 295.46 (7.22%) 167.69 (4.09%)<br />
Median 57.44 (1.40%) 51.70 (1.26%) 46.30 (1.13%)<br />
Mean 65.57 (1.60%) 63.98 (1.56%) 52.99 (1.29%)<br />
Stdev 45.24 (1.10%) 51.31 (1.25%) 40.77 (1.00%)<br />
Table 13: Minimum and maximum, median, mean values, and standard deviations<br />
<strong>of</strong> the residuals <strong>of</strong> R, G, and B values with respect to the values <strong>of</strong> the RAW image.<br />
The RGB values lie in the range <strong>of</strong> 0 to 4095. Relative errors are given in brackets.<br />
the measured values <strong>for</strong> patch j, and n is the number <strong>of</strong> patches used in our tests.<br />
We obtain the optimal coefficients <strong>for</strong> ri, gi and bi by minimizing ∆R, ∆G, and<br />
∆B. We do this by using non-linear regression.<br />
The spectra we use in this case are the spectra <strong>of</strong> the n = 140 patches <strong>of</strong> the<br />
ColorChecker SG. Those were measured with a GretagMacbeth Spectrolino (see<br />
section 6.3).<br />
In order to avoid inaccuracies due to image enhancement we use the RAW<br />
image <strong>for</strong> gaining the RGB values (see section 6.1.4). Again, we search <strong>for</strong> the<br />
most representative RGB value in a subarea <strong>of</strong> each patch. As the Canon EOS<br />
20D is a 12bit camera, the RGB values are in the range <strong>of</strong> 0 to 4095.<br />
The results <strong>of</strong> the mapping cannot be compared to methods that are operat-<br />
ing in L ∗ a ∗ b ∗ space. Our results are part <strong>of</strong> the camera’s RAW RGB space and<br />
can there<strong>for</strong>e not easily be converted to XYZ and then L ∗ a ∗ b ∗ space. We would<br />
have to find a mapping from camera’s RAW RGB to XYZ that again will intro-<br />
duce some error. There<strong>for</strong>e, we analyze the difference <strong>of</strong> calculated RGB values<br />
to the ones that were actually produced by a camera. In order to test the quality<br />
<strong>of</strong> our mapping, we use the 140 spectra (the same that were used to generate the<br />
mapping) as input value and compare the result to the RGB values <strong>of</strong> the camera.<br />
Absolute values <strong>for</strong> minimum, maximum, mean value, median, and standard de-<br />
viation <strong>of</strong> this comparison can be found in table 13. The maximum error <strong>of</strong> 7.22%<br />
occurs in the green channel. The mean value <strong>of</strong> 1.56% is much lower though<br />
so we can assume that there are only a few outliers. The same tendency can be<br />
observed <strong>for</strong> the other two channels. Moreover we can see that the blue channel<br />
causes the least amount <strong>of</strong> error in general. The residuals <strong>for</strong> R, G, and B channels<br />
<strong>for</strong> all 140 patches can be found in appendix E.5.<br />
This method has two main advantages: We do not need any knowledge about<br />
84