Usability of Digital Cameras for Verifying Physically Based ...
Usability of Digital Cameras for Verifying Physically Based ...
Usability of Digital Cameras for Verifying Physically Based ...

Create successful ePaper yourself
Turn your PDF publications into a flip-book with our unique Google optimized e-Paper software.
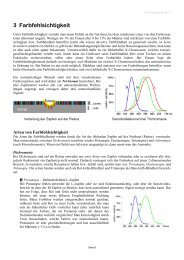
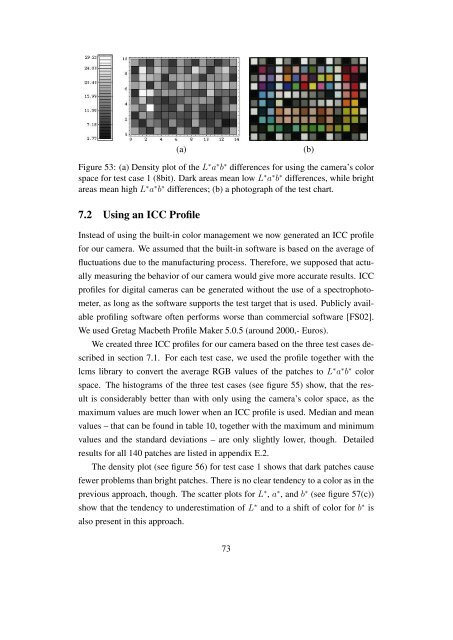
(a) (b)<br />
Figure 53: (a) Density plot <strong>of</strong> the L ∗ a ∗ b ∗ differences <strong>for</strong> using the camera’s color<br />
space <strong>for</strong> test case 1 (8bit). Dark areas mean low L ∗ a ∗ b ∗ differences, while bright<br />
areas mean high L ∗ a ∗ b ∗ differences; (b) a photograph <strong>of</strong> the test chart.<br />
7.2 Using an ICC Pr<strong>of</strong>ile<br />
Instead <strong>of</strong> using the built-in color management we now generated an ICC pr<strong>of</strong>ile<br />
<strong>for</strong> our camera. We assumed that the built-in s<strong>of</strong>tware is based on the average <strong>of</strong><br />
fluctuations due to the manufacturing process. There<strong>for</strong>e, we supposed that actu-<br />
ally measuring the behavior <strong>of</strong> our camera would give more accurate results. ICC<br />
pr<strong>of</strong>iles <strong>for</strong> digital cameras can be generated without the use <strong>of</strong> a spectrophoto-<br />
meter, as long as the s<strong>of</strong>tware supports the test target that is used. Publicly avail-<br />
able pr<strong>of</strong>iling s<strong>of</strong>tware <strong>of</strong>ten per<strong>for</strong>ms worse than commercial s<strong>of</strong>tware [FS02].<br />
We used Gretag Macbeth Pr<strong>of</strong>ile Maker 5.0.5 (around 2000,- Euros).<br />
We created three ICC pr<strong>of</strong>iles <strong>for</strong> our camera based on the three test cases de-<br />
scribed in section 7.1. For each test case, we used the pr<strong>of</strong>ile together with the<br />
lcms library to convert the average RGB values <strong>of</strong> the patches to L ∗ a ∗ b ∗ color<br />
space. The histograms <strong>of</strong> the three test cases (see figure 55) show, that the res-<br />
ult is considerably better than with only using the camera’s color space, as the<br />
maximum values are much lower when an ICC pr<strong>of</strong>ile is used. Median and mean<br />
values – that can be found in table 10, together with the maximum and minimum<br />
values and the standard deviations – are only slightly lower, though. Detailed<br />
results <strong>for</strong> all 140 patches are listed in appendix E.2.<br />
The density plot (see figure 56) <strong>for</strong> test case 1 shows that dark patches cause<br />
fewer problems than bright patches. There is no clear tendency to a color as in the<br />
previous approach, though. The scatter plots <strong>for</strong> L ∗ , a ∗ , and b ∗ (see figure 57(c))<br />
show that the tendency to underestimation <strong>of</strong> L ∗ and to a shift <strong>of</strong> color <strong>for</strong> b ∗ is<br />
also present in this approach.<br />
73