Usability of Digital Cameras for Verifying Physically Based ...
Usability of Digital Cameras for Verifying Physically Based ...
Usability of Digital Cameras for Verifying Physically Based ...

You also want an ePaper? Increase the reach of your titles
YUMPU automatically turns print PDFs into web optimized ePapers that Google loves.
i \ j 0 1 2 3 4 5 6 7 8 9 10 11 12 13 14 15<br />
0 26.16<br />
1 25.12<br />
2 25.53<br />
3 24.76<br />
4 25.63<br />
24.57<br />
23.67<br />
23.76<br />
22.90<br />
23.80<br />
23.32<br />
22.08<br />
21.06<br />
19.73<br />
19.67<br />
19.84<br />
18.92<br />
17.64<br />
16.26<br />
16.35<br />
16.31<br />
16.05<br />
14.77<br />
14.02<br />
14.17<br />
14.74<br />
14.10<br />
12.51<br />
11.61<br />
11.43<br />
13.69<br />
12.97<br />
11.19<br />
9.52<br />
9.12<br />
11.59<br />
13.37<br />
12.93<br />
10.06<br />
6.28<br />
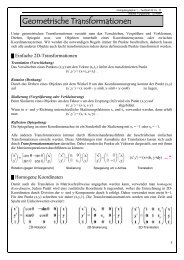
Table 3: Standard deviation <strong>of</strong> all 80 submatrices <strong>for</strong> D65 and dimmer setting<br />
100%.<br />
11.59<br />
13.37<br />
12.93<br />
10.06<br />
6.28<br />
In order to find the optimal position <strong>for</strong> placing the color chart, we were<br />
searching <strong>for</strong> a subarea <strong>of</strong> the size <strong>of</strong> a color chart, where the standard deviation<br />
<strong>of</strong> the difference in luminance distribution is minimal. The GretagMacbeth Color<br />
Checker SG has 4x5 white patches in the boarder area. As we chose our meas-<br />
urement points according to the distance between two <strong>of</strong> those white patches, we<br />
have to find the 4x5 submatrix in our 8x20 matrix <strong>of</strong> measurements, that has the<br />
smallest standard deviation. The number <strong>of</strong> possible candidates is 80, as we have<br />
5 submatrices in vertical direction and 16 submatrices in horizontal direction. We<br />
simply calculate the standard deviation <strong>for</strong> all possible submatrices and choose<br />
the one with the smallest result. Tables 3, 4, 5 and 6 show the results <strong>of</strong> these<br />
calculations; the smallest results are emphasized. For the submatrices with the<br />
most even luminance difference distribution the standard deviations are 6.28 <strong>for</strong><br />
dimmer setting 100%, 1.61 <strong>for</strong> 50%, 1.12 <strong>for</strong> 25% and 0.96 <strong>for</strong> 15%. Figure 42<br />
shows Mathematica plots <strong>of</strong> the same results. These results clearly show that <strong>for</strong><br />
D65 the best position <strong>for</strong> the color chart is in the middle part <strong>of</strong> the front region.<br />
Our results <strong>for</strong> lightsource 840 at dimmer settings 100% and 50% are shown<br />
in figure 43 (a) and (b). Again we scaled the values <strong>of</strong> 50% by 2 (see figure 43<br />
(c)) and visualized the difference to the values <strong>of</strong> 100% (d). Figure 44 shows<br />
the according plots <strong>for</strong> lightsource CWF. Standard deviation <strong>for</strong> dimmer settings<br />
100% and 50% are shown in figures 45 (840) and 46 (CWF). The maximum values<br />
are 40.39 cd/m 2 (840) and 40.30 cd/m 2 (CWF), which is considerably higher<br />
than 26.16 cd/m 2 <strong>for</strong> D65. The lowest values <strong>for</strong> 840 are also in the middle part<br />
60<br />
13.69<br />
12.97<br />
11.19<br />
9.52<br />
9.12<br />
14.74<br />
14.10<br />
12.51<br />
11.61<br />
11.43<br />
16.31<br />
16.05<br />
14.77<br />
14.02<br />
14.17<br />
19.84<br />
18.92<br />
17.64<br />
16.26<br />
16.35<br />
23.32<br />
22.08<br />
21.06<br />
19.73<br />
19.67<br />
24.57<br />
23.67<br />
23.76<br />
22.90<br />
23.80<br />
26.16<br />
25.12<br />
25.53<br />
24.76<br />
25.63