Usability of Digital Cameras for Verifying Physically Based ...
Usability of Digital Cameras for Verifying Physically Based ...
Usability of Digital Cameras for Verifying Physically Based ...

You also want an ePaper? Increase the reach of your titles
YUMPU automatically turns print PDFs into web optimized ePapers that Google loves.
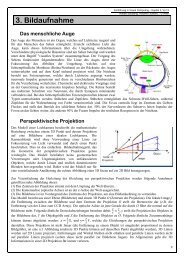
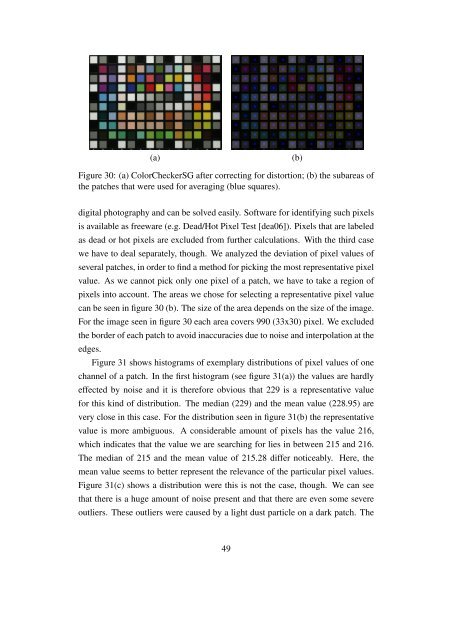
(a) (b)<br />
Figure 30: (a) ColorCheckerSG after correcting <strong>for</strong> distortion; (b) the subareas <strong>of</strong><br />
the patches that were used <strong>for</strong> averaging (blue squares).<br />
digital photography and can be solved easily. S<strong>of</strong>tware <strong>for</strong> identifying such pixels<br />
is available as freeware (e.g. Dead/Hot Pixel Test [dea06]). Pixels that are labeled<br />
as dead or hot pixels are excluded from further calculations. With the third case<br />
we have to deal separately, though. We analyzed the deviation <strong>of</strong> pixel values <strong>of</strong><br />
several patches, in order to find a method <strong>for</strong> picking the most representative pixel<br />
value. As we cannot pick only one pixel <strong>of</strong> a patch, we have to take a region <strong>of</strong><br />
pixels into account. The areas we chose <strong>for</strong> selecting a representative pixel value<br />
can be seen in figure 30 (b). The size <strong>of</strong> the area depends on the size <strong>of</strong> the image.<br />
For the image seen in figure 30 each area covers 990 (33x30) pixel. We excluded<br />
the border <strong>of</strong> each patch to avoid inaccuracies due to noise and interpolation at the<br />
edges.<br />
Figure 31 shows histograms <strong>of</strong> exemplary distributions <strong>of</strong> pixel values <strong>of</strong> one<br />
channel <strong>of</strong> a patch. In the first histogram (see figure 31(a)) the values are hardly<br />
effected by noise and it is there<strong>for</strong>e obvious that 229 is a representative value<br />
<strong>for</strong> this kind <strong>of</strong> distribution. The median (229) and the mean value (228.95) are<br />
very close in this case. For the distribution seen in figure 31(b) the representative<br />
value is more ambiguous. A considerable amount <strong>of</strong> pixels has the value 216,<br />
which indicates that the value we are searching <strong>for</strong> lies in between 215 and 216.<br />
The median <strong>of</strong> 215 and the mean value <strong>of</strong> 215.28 differ noticeably. Here, the<br />
mean value seems to better represent the relevance <strong>of</strong> the particular pixel values.<br />
Figure 31(c) shows a distribution were this is not the case, though. We can see<br />
that there is a huge amount <strong>of</strong> noise present and that there are even some severe<br />
outliers. These outliers were caused by a light dust particle on a dark patch. The<br />
49