

Customer Information Driven After Sales Service ... - RePub
Customer Information Driven After Sales Service ... - RePub
Customer Information Driven After Sales Service ... - RePub

Create successful ePaper yourself
Turn your PDF publications into a flip-book with our unique Google optimized e-Paper software.
<strong>Customer</strong> Heterogeneity and Demand / Capacity Ratio<br />
4.5. Numerical Experiments<br />
We perform the numerical experiments at various D/C ratios. Table 4.7 depicts the<br />
results of the simulation experiments. First we discuss the average profits at various<br />
D/C ratios. Similar to the small scenario, we observe negligible gains for over-stocking<br />
situations. For under-stocking situations, the improvements over the SRH are quite<br />
significant. The improvements depict that the RMH performs increasingly better than<br />
the SRH with higher under-stocking of the stock network. The results also depict an<br />
insignificant difference between the RMH and the RMH+. This confirms our earlier<br />
argument that the local optimum in the vicinity of the customer is highly likely to be<br />
the global optimum.<br />
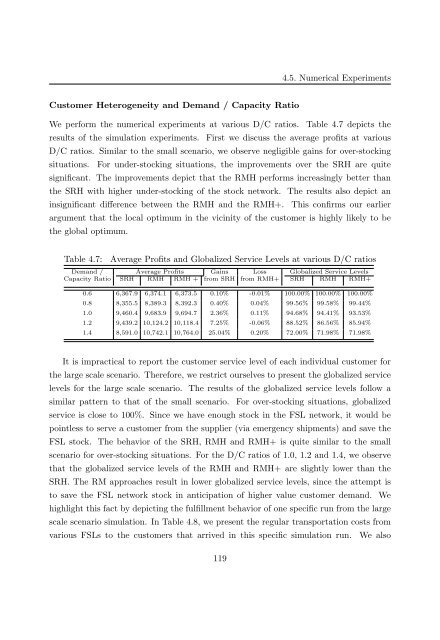
Table 4.7: Average Profits and Globalized <strong>Service</strong> Levels at various D/C ratios<br />
Demand / Average Profits Gains Loss Globalized <strong>Service</strong> Levels<br />
Capacity Ratio SRH RMH RMH + from SRH from RMH+ SRH RMH RMH+<br />
0.6 6,367.9 6,374.1 6,373.5 0.10% -0.01% 100.00% 100.00% 100.00%<br />
0.8 8,355.5 8,389.3 8,392.3 0.40% 0.04% 99.56% 99.58% 99.44%<br />
1.0 9,460.4 9,683.9 9,694.7 2.36% 0.11% 94.68% 94.41% 93.53%<br />
1.2 9,439.2 10,124.2 10,118.4 7.25% -0.06% 88.52% 86.56% 85.94%<br />
1.4 8,591.0 10,742.1 10,764.0 25.04% 0.20% 72.00% 71.98% 71.98%<br />
It is impractical to report the customer service level of each individual customer for<br />
the large scale scenario. Therefore, we restrict ourselves to present the globalized service<br />
levels for the large scale scenario. The results of the globalized service levels follow a<br />
similar pattern to that of the small scenario. For over-stocking situations, globalized<br />
service is close to 100%. Since we have enough stock in the FSL network, it would be<br />
pointless to serve a customer from the supplier (via emergency shipments) and save the<br />
FSL stock. The behavior of the SRH, RMH and RMH+ is quite similar to the small<br />
scenario for over-stocking situations. For the D/C ratios of 1.0, 1.2 and 1.4, we observe<br />
that the globalized service levels of the RMH and RMH+ are slightly lower than the<br />
SRH. The RM approaches result in lower globalized service levels, since the attempt is<br />
to save the FSL network stock in anticipation of higher value customer demand. We<br />
highlight this fact by depicting the fulfillment behavior of one specific run from the large<br />
scale scenario simulation. In Table 4.8, we present the regular transportation costs from<br />
various FSLs to the customers that arrived in this specific simulation run. We also<br />
119


