

Customer Information Driven After Sales Service ... - RePub
Customer Information Driven After Sales Service ... - RePub
Customer Information Driven After Sales Service ... - RePub

You also want an ePaper? Increase the reach of your titles
YUMPU automatically turns print PDFs into web optimized ePapers that Google loves.
3.6. Data Quality and its Analysis<br />
in the dataset by following the underlying behavior of the business phenomena.<br />
Scenario 5: Heterogeneously Distributed Accuracy Error - HQ Error<br />
Due to the specific business situation (as outlined in Section 3.6.1), a concentration of<br />
installs is listed at a single location; whereas in reality, these installs are geographically<br />
dispersed at various locations. We formulate this behavior at varying levels of error<br />
intensity and subsequently observe the system behavior at different demand levels. The<br />
test bed parameters are again listed in Appendix - 3A. Figure 3.6 shows the planning<br />
system behavior for this scenario.<br />
Due to the slow moving nature of spare parts demand, 1 unit per week (for the<br />
complete network) is the typically observed demand for such an installed base size. The<br />
10% error case relates to a customer who owns 10% of the total installs. The spare parts<br />
logistics provider has listed all the specific customer’s installs at the company’s head<br />
quarter location. In reality, the machines are dispersed homogeneously throughout the<br />
geographical network at the sub-locations. We observe cost variations from 2.92% to<br />
Percentage Cost Deviation<br />
20%<br />
16%<br />
12%<br />
8%<br />
4%<br />
0%<br />
2.92%<br />
18.09%<br />
12.05%<br />
10% 20% 30%<br />
Error Frequency<br />
Percentage Cost Deviation<br />
20%<br />
16%<br />
12%<br />
8%<br />
4%<br />
0%<br />
2.91%<br />
10.85%<br />
10.85%<br />
10% 20% 30%<br />
Error Frequency<br />
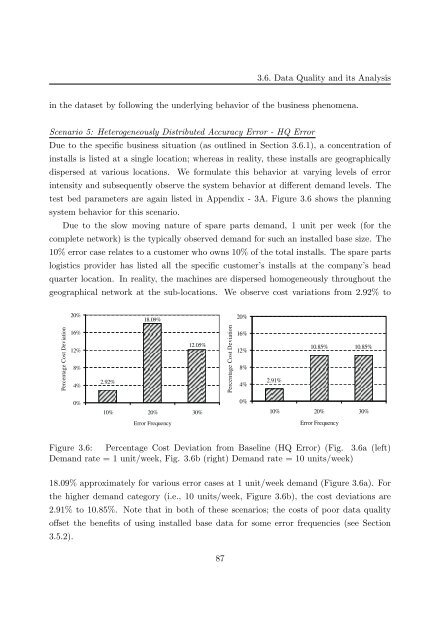
Figure 3.6: Percentage Cost Deviation from Baseline (HQ Error) (Fig. 3.6a (left)<br />
Demand rate = 1 unit/week, Fig. 3.6b (right) Demand rate = 10 units/week)<br />
18.09% approximately for various error cases at 1 unit/week demand (Figure 3.6a). For<br />
the higher demand category (i.e., 10 units/week, Figure 3.6b), the cost deviations are<br />
2.91% to 10.85%. Note that in both of these scenarios; the costs of poor data quality<br />
offset the benefits of using installed base data for some error frequencies (see Section<br />
3.5.2).<br />
87


