A Finite Element Program (FECGS): Post-Processor FEPOST - GKSS
A Finite Element Program (FECGS): Post-Processor FEPOST - GKSS
A Finite Element Program (FECGS): Post-Processor FEPOST - GKSS
Create successful ePaper yourself
Turn your PDF publications into a flip-book with our unique Google optimized e-Paper software.
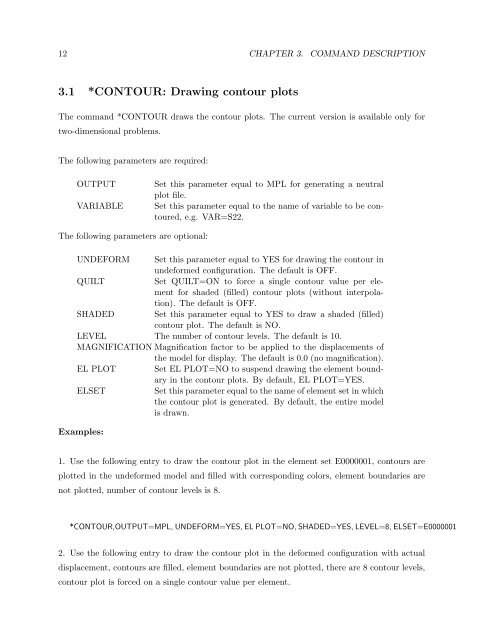
12 CHAPTER 3. COMMAND DESCRIPTION<br />
3.1 *CONTOUR: Drawing contour plots<br />
The command *CONTOUR draws the contour plots. The current version is available only for<br />
two-dimensional problems.<br />
The following parameters are required:<br />
OUTPUT Set this parameter equal to MPL for generating a neutral<br />
plot file.<br />
VARIABLE Set this parameter equal to the name of variable to be contoured,<br />
e.g. VAR=S22.<br />
The following parameters are optional:<br />
UNDEFORM Set this parameter equal to YES for drawing the contour in<br />
undeformed configuration. The default is OFF.<br />
QUILT Set QUILT=ON to force a single contour value per element<br />
for shaded (filled) contour plots (without interpolation).<br />
The default is OFF.<br />
SHADED Set this parameter equal to YES to draw a shaded (filled)<br />
contour plot. The default is NO.<br />
LEVEL The number of contour levels. The default is 10.<br />
MAGNIFICATION Magnification factor to be applied to the displacements of<br />
the model for display. The default is 0.0 (no magnification).<br />
EL PLOT Set EL PLOT=NO to suspend drawing the element boundary<br />
in the contour plots. By default, EL PLOT=YES.<br />
ELSET Set this parameter equal to the name of element set in which<br />
the contour plot is generated. By default, the entire model<br />
is drawn.<br />
Examples:<br />
1. Use the following entry to draw the contour plot in the element set E0000001, contours are<br />
plotted in the undeformed model and filled with corresponding colors, element boundaries are<br />
not plotted, number of contour levels is 8.<br />
*CONTOUR,OUTPUT=MPL, UNDEFORM=YES, EL PLOT=NO, SHADED=YES, LEVEL=8, ELSET=E0000001<br />
2. Use the following entry to draw the contour plot in the deformed configuration with actual<br />
displacement, contours are filled, element boundaries are not plotted, there are 8 contour levels,<br />
contour plot is forced on a single contour value per element.


