Biotechnology in Animal Husbandry - Institut za Stočarstvo
Biotechnology in Animal Husbandry - Institut za Stočarstvo
Biotechnology in Animal Husbandry - Institut za Stočarstvo

You also want an ePaper? Increase the reach of your titles
YUMPU automatically turns print PDFs into web optimized ePapers that Google loves.
The correlation between hygienic parameters ...<br />
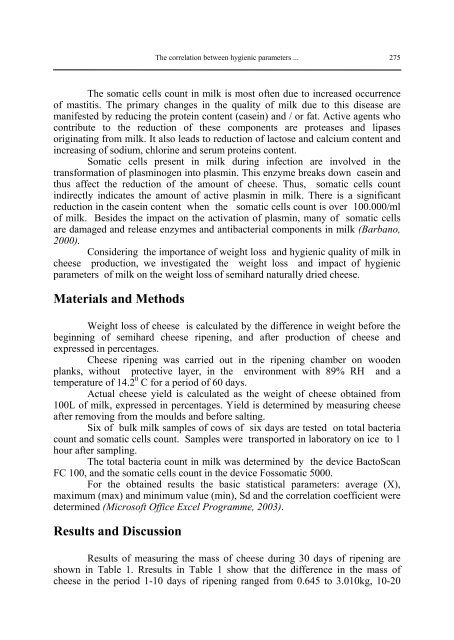
The somatic cells count <strong>in</strong> milk is most often due to <strong>in</strong>creased occurrence<br />
of mastitis. The primary changes <strong>in</strong> the quality of milk due to this disease are<br />
manifested by reduc<strong>in</strong>g the prote<strong>in</strong> content (case<strong>in</strong>) and / or fat. Active agents who<br />
contribute to the reduction of these components are proteases and lipases<br />
orig<strong>in</strong>at<strong>in</strong>g from milk. It also leads to reduction of lactose and calcium content and<br />
<strong>in</strong>creas<strong>in</strong>g of sodium, chlor<strong>in</strong>e and serum prote<strong>in</strong>s content.<br />
Somatic cells present <strong>in</strong> milk dur<strong>in</strong>g <strong>in</strong>fection are <strong>in</strong>volved <strong>in</strong> the<br />
transformation of plasm<strong>in</strong>ogen <strong>in</strong>to plasm<strong>in</strong>. This enzyme breaks down case<strong>in</strong> and<br />
thus affect the reduction of the amount of cheese. Thus, somatic cells count<br />
<strong>in</strong>directly <strong>in</strong>dicates the amount of active plasm<strong>in</strong> <strong>in</strong> milk. There is a significant<br />
reduction <strong>in</strong> the case<strong>in</strong> content when the somatic cells count is over 100.000/ml<br />
of milk. Besides the impact on the activation of plasm<strong>in</strong>, many of somatic cells<br />
are damaged and release enzymes and antibacterial components <strong>in</strong> milk (Barbano,<br />
2000).<br />
Consider<strong>in</strong>g the importance of weight loss and hygienic quality of milk <strong>in</strong><br />
cheese production, we <strong>in</strong>vestigated the weight loss and impact of hygienic<br />
parameters of milk on the weight loss of semihard naturally dried cheese.<br />
Materials and Мethods<br />
Weight loss of cheese is calculated by the difference <strong>in</strong> weight before the<br />
beg<strong>in</strong>n<strong>in</strong>g of semihard cheese ripen<strong>in</strong>g, and after production of cheese and<br />
expressed <strong>in</strong> percentages.<br />
Cheese ripen<strong>in</strong>g was carried out <strong>in</strong> the ripen<strong>in</strong>g chamber on wooden<br />
planks, without protective layer, <strong>in</strong> the environment with 89% RH and a<br />
temperature of 14.2 0 C for a period of 60 days.<br />
Actual cheese yield is calculated as the weight of cheese obta<strong>in</strong>ed from<br />
100L of milk, expressed <strong>in</strong> percentages. Yield is determ<strong>in</strong>ed by measur<strong>in</strong>g cheese<br />
after remov<strong>in</strong>g from the moulds and before salt<strong>in</strong>g.<br />
Six of bulk milk samples of cows of six days are tested on total bacteria<br />
count and somatic cells count. Samples were transported <strong>in</strong> laboratory on ice to 1<br />
hour after sampl<strong>in</strong>g.<br />
The total bacteria count <strong>in</strong> milk was determ<strong>in</strong>ed by the device BactoScan<br />
FC 100, and the somatic cells count <strong>in</strong> the device Fossomatic 5000.<br />
For the obta<strong>in</strong>ed results the basic statistical parameters: average (X),<br />
maximum (max) and m<strong>in</strong>imum value (m<strong>in</strong>), Sd and the correlation coefficient were<br />
determ<strong>in</strong>ed (Microsoft Office Excel Programme, 2003).<br />
Results and Discussion<br />
Results of measur<strong>in</strong>g the mass of cheese dur<strong>in</strong>g 30 days of ripen<strong>in</strong>g are<br />
shown <strong>in</strong> Table 1. Rresults <strong>in</strong> Table 1 show that the difference <strong>in</strong> the mass of<br />
cheese <strong>in</strong> the period 1-10 days of ripen<strong>in</strong>g ranged from 0.645 to 3.010kg, 10-20<br />
275