Performance Report for FY 2009/10 - UWASNET
Performance Report for FY 2009/10 - UWASNET
Performance Report for FY 2009/10 - UWASNET

Create successful ePaper yourself
Turn your PDF publications into a flip-book with our unique Google optimized e-Paper software.
<strong>Per<strong>for</strong>mance</strong> <strong>Report</strong> <strong>for</strong> <strong>FY</strong> <strong>2009</strong>/<strong>10</strong><br />
During <strong>FY</strong> <strong>2009</strong>/<strong>10</strong>. a total of UGX 18.5 billion was in invested by <strong>UWASNET</strong> and WASH cluster<br />
member, reflecting a decrease of UGX 0.7 billion from last years total investment of UGX 19.2<br />
billion. The was a decrease in investment by WASH Cluster members from UGX 3.2 billion in<br />
<strong>FY</strong> 2008/9 to UGX 3 billion. The decrease is associated with reduction of total investment in<br />
the WASH cluster following the return of IDPs to their villages. Despite the increase in number<br />
of NGOs reporting there is decrease in the <strong>UWASNET</strong> investment from UGX 16 billion during<br />
the <strong>FY</strong> 2008/9 to UGX 15.5 billion during the <strong>FY</strong> <strong>2009</strong>/<strong>10</strong>. Reasons <strong>for</strong> the decrease in total<br />
investment by the <strong>UWASNET</strong> members include the credit crunch and change of donor strategy<br />
from supporting individual NGOs to supporting consortiums of organisations. However it must<br />
also be noted that not all reporting NGOs/CBOs indicated their investments. Gaps in reporting<br />
continue to be a major bottleneck in defining NGO investment into the subsector.<br />
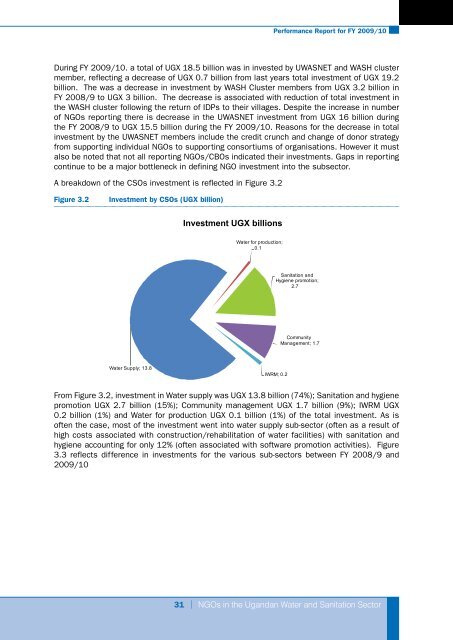
A breakdown of the CSOs investment is reflected in Figure 3.2<br />
Figure 3.2 Investment by CSOs (UGX billion)<br />
Water Supply; 13.8<br />
Investment UGX billions<br />
Water <strong>for</strong> production;<br />
0.1<br />
Sanitation and<br />
Hygiene promotion;<br />
2.7<br />
IWRM; 0.2<br />
Community<br />
Management; 1.7<br />
From Figure 3.2, investment in Water supply was UGX 13.8 billion (74%); Sanitation and hygiene<br />
promotion UGX 2.7 billion (15%); Community management UGX 1.7 billion (9%); IWRM UGX<br />
0.2 billion (1%) and Water <strong>for</strong> production UGX 0.1 billion (1%) of the total investment. As is<br />
often the case, most of the investment went into water supply sub-sector (often as a result of<br />
high costs associated with construction/rehabilitation of water facilities) with sanitation and<br />
hygiene accounting <strong>for</strong> only 12% (often associated with software promotion activities). Figure<br />
3.3 reflects difference in investments <strong>for</strong> the various sub-sectors between <strong>FY</strong> 2008/9 and<br />
<strong>2009</strong>/<strong>10</strong><br />
31 | NGOs in the Ugandan Water and Sanitation Sector