Performance Report for FY 2009/10 - UWASNET
Performance Report for FY 2009/10 - UWASNET
Performance Report for FY 2009/10 - UWASNET

You also want an ePaper? Increase the reach of your titles
YUMPU automatically turns print PDFs into web optimized ePapers that Google loves.
<strong>Per<strong>for</strong>mance</strong> <strong>Report</strong> <strong>for</strong> <strong>FY</strong> <strong>2009</strong>/<strong>10</strong><br />
4 <strong>Per<strong>for</strong>mance</strong> of NGO and CBOs<br />
against the WASH Subsector<br />
Golden Indicators<br />
4.1 Introduction<br />
As actors in the WASH subsector, NGOs and CBOs have a responsibility to contribute to<br />
monitoring of sector per<strong>for</strong>mance. This can only be effectively achieved by active contribution<br />
to district reporting to enable government progressively capture the contribution of NGOs and<br />
CBOs through reports from districts. The Subsector per<strong>for</strong>mance measurement framework<br />
provides eleven “Golden Indicators”against which the per<strong>for</strong>mance of the Water and Sanitation<br />
sub-sector is measured. As in the <strong>2009</strong> NGO Group <strong>Per<strong>for</strong>mance</strong> <strong>Report</strong>, this chapter is<br />
structured to allow <strong>for</strong> reporting of NGOs and CBOs contribution against the Golden Indicators.<br />
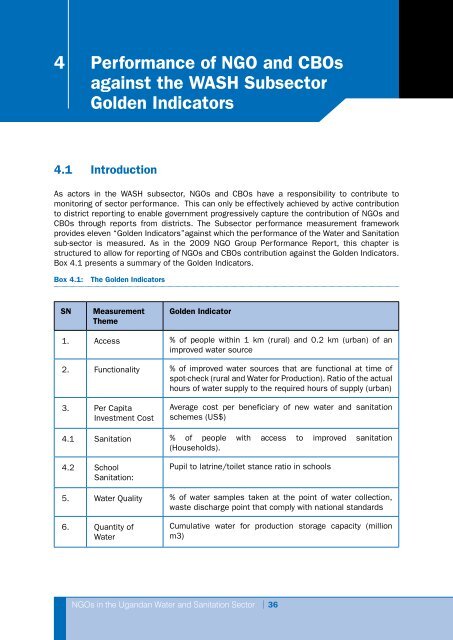
Box 4.1 presents a summary of the Golden Indicators.<br />
Box 4.1: The Golden Indicators<br />
SN Measurement<br />
Theme<br />
Golden Indicator<br />
1. Access % of people within 1 km (rural) and 0.2 km (urban) of an<br />
improved water source<br />
2. Functionality % of improved water sources that are functional at time of<br />
spot-check (rural and Water <strong>for</strong> Production). Ratio of the actual<br />
hours of water supply to the required hours of supply (urban)<br />
3. Per Capita<br />
Investment Cost<br />
Average cost per beneficiary of new water and sanitation<br />
schemes (US$)<br />
4.1 Sanitation % of people with access to improved sanitation<br />
(Households).<br />
4.2 School<br />
Sanitation:<br />
Pupil to latrine/toilet stance ratio in schools<br />
5. Water Quality % of water samples taken at the point of water collection,<br />
waste discharge point that comply with national standards<br />
6. Quantity of<br />
Water<br />
Cumulative water <strong>for</strong> production storage capacity (million<br />
m3)<br />
NGOs in the Ugandan Water and Sanitation Sector | 36