Performance Report for FY 2009/10 - UWASNET
Performance Report for FY 2009/10 - UWASNET
Performance Report for FY 2009/10 - UWASNET

Create successful ePaper yourself
Turn your PDF publications into a flip-book with our unique Google optimized e-Paper software.
SN Measurement<br />
Theme<br />
Golden Indicator<br />
<strong>Per<strong>for</strong>mance</strong> <strong>Report</strong> <strong>for</strong> <strong>FY</strong> <strong>2009</strong>/<strong>10</strong><br />
7. Equity Mean Sub-County deviation from the district average number<br />
of persons per improved water point. (Mean Sub-County<br />
deviation from the National average number of persons per<br />
improved water point presented here)<br />
8. Handwashing % of people with access to hand-washing facilities.<br />
9. Management % of water points with actively functioning Water & Sanitation<br />
Committees/ Water Supply and Sewerage Boards.<br />
<strong>10</strong>. Gender % of Water User committees/Water Boards with women<br />
holding key positions.<br />
11. Water<br />
Resources<br />
Management<br />
Compliance<br />
% of water abstraction and discharge permits holders<br />
complying with permit conditions<br />
4.2 CSO Contribution to Increased Access to Water<br />
Supplies<br />
NGOs and CBOs have continued to develop improved water sources in both rural and urban<br />
areas thus contributing to improving access 4 to improved water sources.<br />
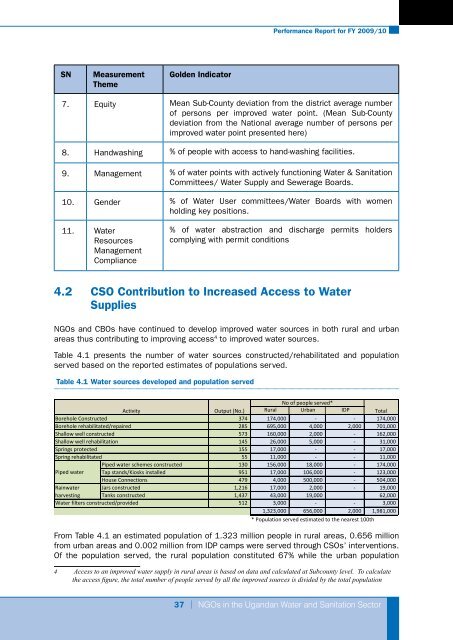
Table 4.1 presents the number of water sources constructed/rehabilitated and population<br />
served based on the reported estimates of populations served.<br />
Table 4.1 Water sources developed and population served<br />
Activity<br />
Output (No.)<br />
Borehole Constructed<br />
374<br />
Borehole rehabilitated/repaired<br />
285<br />
Shallow well constructed<br />
573<br />
Shallow well rehabilitation 145<br />
Springs protected<br />
155<br />
Spring rehabilitated<br />
55<br />
Piped water schemes constructed 130<br />
Piped water<br />
Tap stands/Kiosks installed 951<br />
House Connections 479<br />
Rainwater Jars constructed 1,216<br />
harvesting Tanks constructed 1,437<br />
Water filters constructed/provided<br />
512<br />
Rural<br />
No of people served*<br />
Urban IDP<br />
174,000<br />
695,000<br />
160,000<br />
26,000<br />
17,000<br />
11,000<br />
156,000<br />
17,000<br />
4,000<br />
17,000<br />
43,000<br />
3,000<br />
1,323,000<br />
-<br />
4,000<br />
2,000<br />
5,000<br />
-<br />
-<br />
18,000<br />
<strong>10</strong>6,000<br />
500,000<br />
2,000<br />
19,000<br />
-<br />
656,000<br />
From Table 4.1 an estimated population of 1.323 million people in rural areas, 0.656 million<br />
from urban areas and 0.002 million from IDP camps were served through CSOs’ interventions.<br />
Of the population served, the rural population constituted 67% while the urban population<br />
4 Access to an improved water supply in rural areas is based on data and calculated at Subcounty level. To calculate<br />
the access figure, the total number of people served by all the improved sources is divided by the total population<br />
-<br />
2,000<br />
-<br />
-<br />
-<br />
-<br />
-<br />
-<br />
-<br />
-<br />
-<br />
2,000<br />
* Population served estimated to the nearest <strong>10</strong>0th<br />
37 | NGOs in the Ugandan Water and Sanitation Sector<br />
Total<br />
174,000<br />
701,000<br />
162,000<br />
31,000<br />
17,000<br />
11,000<br />
174,000<br />
123,000<br />
504,000<br />
19,000<br />
62,000<br />
3,000<br />
1,981,000