

A Guide to Investing in Trinidad and Tobago (2011) - Ministry of ...
A Guide to Investing in Trinidad and Tobago (2011) - Ministry of ...
A Guide to Investing in Trinidad and Tobago (2011) - Ministry of ...

Create successful ePaper yourself
Turn your PDF publications into a flip-book with our unique Google optimized e-Paper software.
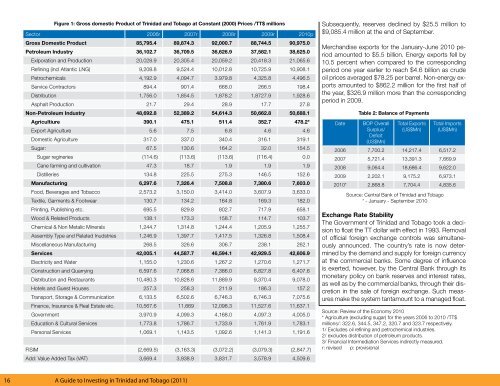
Figure 1: Gross domestic Product <strong>of</strong> Tr<strong>in</strong>idad <strong>and</strong> <strong>Tobago</strong> at Constant (2000) Prices /TT$ millions<br />
Sec<strong>to</strong>r 2006r 2007r 2008r 2009r 2010p<br />
Gross Domestic Product 85,795.4 89,874.3 92,000.7 88,744.5 90,975.0<br />
Petroleum Industry 36,102.7 36,709.5 36,626.9 37,582.1 38,625.0<br />
Exlporation <strong>and</strong> Production 20,028.9 20,305.4 20,059.2 20,418.3 21,065.6<br />
Ref<strong>in</strong><strong>in</strong>g (<strong>in</strong>cl Atlantic LNG) 9,208.8 9,524.4 10,012.8 10,725.9 10,908.1<br />
Petrochemicals 4,192.9 4,094.7 3.979.8 4,325.8 4,496.5<br />
Service Contrac<strong>to</strong>rs 894.4 901.4 668.0 266.5 198.4<br />
Distribution 1,756.0 1,854.5 1,878.2 1,8727.9 1,928.6<br />
Asphalt Production 21.7 29.4 28.9 17.7 27.8<br />
Non-Petroleum Industry 48,692.8 52,389.2 54,614.3 50,662.8 50,688.1<br />
Agricultiure 390.1 475.1 511.4 352.7 478.2*<br />
Export Agriculture 5.6 7.5 6.8 4.6 4.6<br />
Domestic Agriculture 317.0 337.0 340.4 316.1 319.1<br />
Sugar: 67.5 130.6 164.2 32.0 154.5<br />
Sugar reg<strong>in</strong>eries (114.6) (113.6) (113.6) (116.4) 0.0<br />
Cane farm<strong>in</strong>g <strong>and</strong> cultivation 47.3 18.7 1.9 1.9 1.9<br />
Distilleries 134.8 225.5 275.3 146.5 152.6<br />
Manufactur<strong>in</strong>g 6,297.6 7,326.4 7,508.8 7,380.6 7,603.0<br />
Food, Beverages <strong>and</strong> Tobacco 2,573.2 3,150.0 3,414.0 3,607.9 3,633.0<br />
Textile, Garments & Footwear 130.7 134.2 164.8 169.3 182.0<br />
Pr<strong>in</strong>t<strong>in</strong>g, Publish<strong>in</strong>g etc. 695.5 829.8 802.7 717.9 658.1<br />
Wood & Related Products 138.1 173.3 158.7 114.7 103.7<br />
Chemical & Non Metalic M<strong>in</strong>erals 1,244.7 1,314.8 1,244.4 1,205.9 1,255.7<br />
Assembly Type <strong>and</strong> Related Inudstries 1,246.9 1,397.7 1,417.5 1,326.8 1,508.4<br />
Miscellaneous Manufactur<strong>in</strong>g 268.5 326.6 306.7 238.1 262.1<br />
Services 42,005.1 44,587.7 46,594.1 42,929.5 42,606.9<br />
Electricity <strong>and</strong> Water 1,155.0 1,230.6 1,267.2 1,270.6 1,271.7<br />
Construction <strong>and</strong> Quarry<strong>in</strong>g 6,597.6 7,068.6 7,386.0 6,827.8 6,407.6<br />
Distribution <strong>and</strong> Restaurants 10,480.3 10,828.6 11,889.9 9,370.4 9,078.0<br />
Hotels <strong>and</strong> Guest Houses 257.3 258.3 211.9 186.3 157.2<br />
Transport, S<strong>to</strong>rage & Communication 6,133.5 6,502.6 6,746.3 6,746.3 7,075.6<br />
F<strong>in</strong>ance, Insurance & Real Estate etc. 10,567.6 11,669 12,098.3 11,527.6 11,637.1<br />
Government 3,970.9 4,099.3 4,168.0 4,097.3 4,005.0<br />
Education & Cultural Services 1,773.8 1,786.7 1,733.9 1,761.9 1,783.1<br />
Personal Services 1,069.1 1,143.5 1,092.6 1,141.3 1,191.6<br />
FISIM (2,669.5) (3,163.3) (3,072.2) (3,079.3) (2,847.7)<br />
Add: Value Added Tax (VAT) 3,669.4 3,938.9 3,831.7 3,578.9 4,509.6<br />
16 A <strong>Guide</strong> <strong>to</strong> <strong>Invest<strong>in</strong>g</strong> <strong>in</strong> Tr<strong>in</strong>idad <strong>and</strong> <strong>Tobago</strong> (<strong>2011</strong>)<br />
Subsequently, reserves decl<strong>in</strong>ed by $25.5 million <strong>to</strong><br />
$9,085.4 million at the end <strong>of</strong> September.<br />
Merch<strong>and</strong>ise exports for the January-June 2010 period<br />
amounted <strong>to</strong> $5.5 billion. Energy exports fell by<br />
10.5 percent when compared <strong>to</strong> the correspond<strong>in</strong>g<br />
period one year earlier <strong>to</strong> reach $4.6 billion as crude<br />
oil prices averaged $78.25 per barrel. Non-energy exports<br />
amounted <strong>to</strong> $862.2 million for the first half <strong>of</strong><br />
the year, $326.9 million more than the correspond<strong>in</strong>g<br />
period <strong>in</strong> 2009.<br />
Table 2: Balance <strong>of</strong> Payments<br />
Date BOP Overall<br />
Surplus/<br />
Deficit<br />
(US$Mn)<br />
Total Exports<br />
(US$Mn)<br />
Total Imports<br />
(US$Mn)<br />
2006 7,700.2 14,217.4 6,517.2<br />
2007 5,721.4 13,391.3 7,669.9<br />
2008 9,064.4 18,686.4 9,622.0<br />
2009 2,202.1 9,175.2 6,973.1<br />
2010* 2,868.8 7,704.4 4,835.6<br />
Source: Central Bank <strong>of</strong> Tr<strong>in</strong>idad <strong>and</strong> <strong>Tobago</strong><br />
* - January - September 2010<br />
Exchange Rate Stability<br />
The Government <strong>of</strong> Tr<strong>in</strong>idad <strong>and</strong> <strong>Tobago</strong> <strong>to</strong>ok a decision<br />
<strong>to</strong> float the TT dollar with effect <strong>in</strong> 1993. Removal<br />
<strong>of</strong> <strong>of</strong>ficial foreign exchange controls was simultaneously<br />
announced. The country’s rate is now determ<strong>in</strong>ed<br />
by the dem<strong>and</strong> <strong>and</strong> supply for foreign currency<br />
at the commercial banks. Some degree <strong>of</strong> <strong>in</strong>fluence<br />
is exerted, however, by the Central Bank through its<br />
monetary policy on bank reserves <strong>and</strong> <strong>in</strong>terest rates,<br />
as well as by the commercial banks, through their discretion<br />
<strong>in</strong> the sale <strong>of</strong> foreign exchange. Such measures<br />
make the system tantamount <strong>to</strong> a managed float.<br />
Source: Review <strong>of</strong> the Economy 2010<br />
* Agriculture (exclud<strong>in</strong>g sugar) for the years 2006 <strong>to</strong> 2010 /TT$<br />
millions/: 322.6, 344.5, 347.2, 320.7 <strong>and</strong> 323.7 respectively.<br />
1/ Excludes oil ref<strong>in</strong><strong>in</strong>g <strong>and</strong> petrochemical <strong>in</strong>dustries.<br />
2/ excludes distribution <strong>of</strong> petroleum products.<br />
3/ F<strong>in</strong>ancial Intermediation Services <strong>in</strong>directly measured.<br />
r: revised p: provisional