a quarterly report by - Technopak
a quarterly report by - Technopak
a quarterly report by - Technopak

Create successful ePaper yourself
Turn your PDF publications into a flip-book with our unique Google optimized e-Paper software.
perspective<br />
a quar terly repor t <strong>by</strong><br />
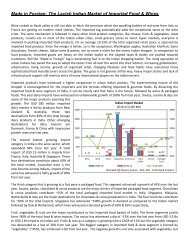
The number of domestic tourists has almost doubled from 309 Mn in 2003 to 612 Mn in 2008. Similarly, the<br />
number of foreign tourist visits has doubled between 2003 and 2008.<br />
Close to 90% of the above visits are fuelled <strong>by</strong> domestic travelers and the dependence on the foreign<br />
travelers is miniscule (only 2%) as shown in Exhibit 2.<br />
Exhibit 2 Exhibit 3<br />
2500<br />
2000<br />
1500<br />
1000<br />
500<br />
0<br />
6.7<br />
309<br />
2003<br />
Tourist Visits In India<br />
97.87% 97.63% 97.96% 98.24%<br />
14.5<br />
598<br />
23.5<br />
1,127<br />
38.0<br />
2,124<br />
2008E 2013F 2013F<br />
Domestic Tourist Visits International Tourist Visits % Domestic<br />
Source: Euromonitor, Tourism Statistics 2007, Ministry of Tourism– Government of India, <strong>Technopak</strong> analysis<br />
100<br />
96<br />
92<br />
88<br />
84<br />
80<br />
The most important growth driver is the robust economic growth that has been witnessed in the country.<br />
India’s GDP has been growing at a rate of 6% since the liberalization of economy in 1991 and has grown<br />
over 8% in the past a few years. At 8% CAGR, India’s GDP would almost triple from US$ 1200 Bn to US$<br />
3500 Bn <strong>by</strong> 2023.<br />
Currently, India is the 12th largest economy in the world in absolute terms and is expected to overtake most<br />
of the European nations in the next 15 to 20 years. It will eventually become the world’s 3rd or 4th largest<br />
economy <strong>by</strong> 2050. Despite the recent economic downturn, various industry sources still peg the economic<br />
growth at over 6%.<br />
India’s strong economic growth has caused the GDP per capita to increase rapidly over the past 5 to 10<br />
years. At the current rate, the GDP per capita in 2013 would be double of what it was in 2003.<br />
More and more families are expected to leave the deprived or aspirers category (annual household income<br />
less than US$ 4200) and join India’s burgeoning middle class. By 2025, the Indian middle class is<br />
expected to constitute 46% of the Indian population. Subsequently, discretionary spends would be<br />
going up and this bodes well for the tourism sector.<br />
In 2005, the Indian middle class was approximately 6% of the population, but is expected to constitute 46%<br />
of the population <strong>by</strong> 2025.<br />
4000<br />
3200<br />
2400<br />
1600<br />
Exhibit 4 Exhibit 5<br />
GDP Per Capita (US$)<br />
1000<br />
800<br />
600<br />
400<br />
200<br />
0<br />
Growth In GDP Per Capita<br />
1998 2003 2008 2013<br />
Source: <strong>Technopak</strong> analysis, Indian Economic Survey 2007-08, Lehman Brothers<br />
GDP Per Capita (US$)<br />
800<br />
India's GDP Growth<br />
2008 2013 2018 2023<br />
Volume 02 / 2009<br />
Germany (2%), 3,800<br />
India (8%), 3,500<br />
UK (2%), 3,300<br />
France (2%), 3,200<br />
Brazil (5%), 2,400<br />
Russia (5%), 2,200<br />
Country (estimated CAGR 2008-23),<br />
GDP in 2023 in US$ billion<br />
Source: Euromonitor, Tourism Statistics 2007, Ministry of Tourism– Government of India, <strong>Technopak</strong> analysis<br />
100<br />
80<br />
60<br />
40<br />
20<br />
0<br />
Distribution of Households Across<br />
Income Brackets<br />
1%<br />
3%<br />
1%<br />
1%<br />
5% 2%<br />
12%<br />
23%<br />
44%<br />
49%<br />
2005<br />
43%<br />
30%<br />
34%<br />
33%<br />
18%<br />
2015 2025<br />
Globals (>208)<br />
Strivers (104-208)<br />
Seekers (42-104)<br />
Aspirers (19-42)<br />
Deprived (