a quarterly report by - Technopak
a quarterly report by - Technopak
a quarterly report by - Technopak

Create successful ePaper yourself
Turn your PDF publications into a flip-book with our unique Google optimized e-Paper software.
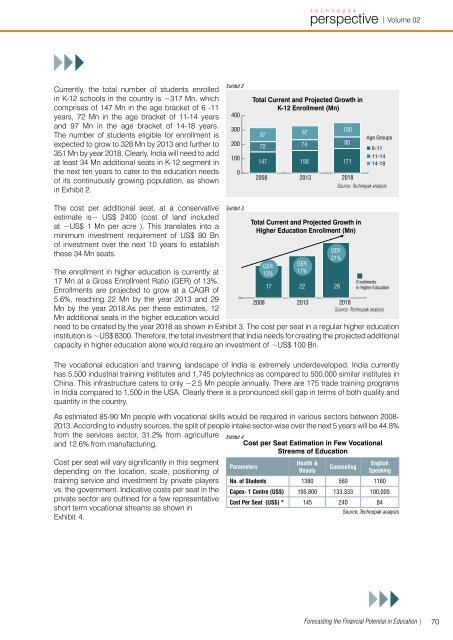
Currently, the total number of students enrolled<br />
in K-12 schools in the country is ~317 Mn, which<br />
comprises of 147 Mn in the age bracket of 6 -11<br />
years, 72 Mn in the age bracket of 11-14 years<br />
and 97 Mn in the age bracket of 14-18 years.<br />
The number of students eligible for enrollment is<br />
expected to grow to 328 Mn <strong>by</strong> 2013 and further to<br />
351 Mn <strong>by</strong> year 2018. Clearly, India will need to add<br />
at least 34 Mn additional seats in K-12 segment in<br />
the next ten years to cater to the education needs<br />
of its continuously growing population, as shown<br />
in Exhibit 2.<br />
The cost per additional seat, at a conservative<br />
estimate is~ US$ 2400 (cost of land included<br />
at ~US$ 1 Mn per acre ). This translates into a<br />
minimum investment requirement of US$ 80 Bn<br />
of investment over the next 10 years to establish<br />
these 34 Mn seats.<br />
The enrollment in higher education is currently at<br />
17 Mn at a Gross Enrollment Ratio (GER) of 13%.<br />
Enrollments are projected to grow at a CAGR of<br />
5.6%, reaching 22 Mn <strong>by</strong> the year 2013 and 29<br />
Mn <strong>by</strong> the year 2018.As per these estimates, 12<br />
Mn additional seats in the higher education would<br />
perspective<br />
a quar terly repor t <strong>by</strong><br />
need to be created <strong>by</strong> the year 2018 as shown in Exhibit 3. The cost per seat in a regular higher education<br />
institution is ~US$ 8300. Therefore, the total investment that India needs for creating the projected additional<br />
capacity in higher education alone would require an investment of ~US$ 100 Bn.<br />
The vocational education and training landscape of India is extremely underdeveloped. India currently<br />
has 5,500 industrial training institutes and 1,745 polytechnics as compared to 500,000 similar institutes in<br />
China. This infrastructure caters to only ~2.5 Mn people annually. There are 175 trade training programs<br />
in India compared to 1,500 in the USA. Clearly there is a pronounced skill gap in terms of both quality and<br />
quantity in the country.<br />
As estimated 85-90 Mn people with vocational skills would be required in various sectors between 2008-<br />
2013. According to industry sources, the split of people intake sector-wise over the next 5 years will be 44.8%<br />
from the services sector, 31.2% from agriculture<br />
and 12.6% from manufacturing.<br />
Cost per seat will vary significantly in this segment<br />
depending on the location, scale, positioning of<br />
training service and investment <strong>by</strong> private players<br />
vs. the government. Indicative costs per seat in the<br />
private sector are outlined for a few representative<br />
short term vocational streams as shown in<br />
Exhibit 4.<br />
Exhibit 2<br />
400<br />
300<br />
200<br />
100<br />
0<br />
Exhibit 3<br />
Parameters<br />
Total Current and Projected Growth in<br />
K-12 Enrollment (Mn)<br />
97<br />
72<br />
147<br />
2008<br />
97<br />
74<br />
158<br />
Health &<br />
Beauty<br />
100<br />
171<br />
2013 2018<br />
Counseling<br />
Volume 02 / 2009<br />
6-11<br />
11-14<br />
14-18<br />
Source: <strong>Technopak</strong> analysis<br />
Exhibit 4<br />
Cost per Seat Estimation in Few Vocational<br />
Streams of Education<br />
English<br />
Speaking<br />
No. of Students 1380 560 1180<br />
Capex- 1 Centre (US$) 195,800 133,333 100,000<br />
Cost Per Seat (US$) * 145 240 84<br />
80<br />
Total Current and Projected Growth in<br />
Higher Education Enrollment (Mn)<br />
GER<br />
13%<br />
17<br />
GER<br />
17%<br />
22<br />
2008 2013<br />
GER<br />
21%<br />
29<br />
Age Groups<br />
Enrollments<br />
in Higher Education<br />
2018<br />
Source: <strong>Technopak</strong> analysis<br />
Source: <strong>Technopak</strong> analysis<br />
| Volume 02<br />
Forecasting the Financial Potential in Education | 70