SURF LIFE SAVING AUSTRALIA ANNUAL REPORT 2007–08
SURF LIFE SAVING AUSTRALIA ANNUAL REPORT 2007–08
SURF LIFE SAVING AUSTRALIA ANNUAL REPORT 2007–08
- TAGS
- surf
- australia
- annual
- sls.com.au
Create successful ePaper yourself
Turn your PDF publications into a flip-book with our unique Google optimized e-Paper software.
NOTES TO AND FORMING PART OF THE FINANCIAL STATEMENTS (continued)<br />
FOR THE YEAR ENDED 30 JUNE 2008<br />
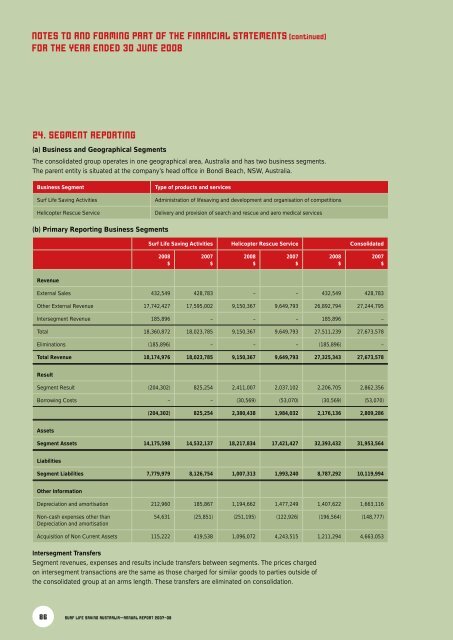
24. SEGMENT <strong>REPORT</strong>ING<br />
(a) Business and Geographical Segments<br />
The consolidated group operates in one geographical area, Australia and has two business segments.<br />
The parent entity is situated at the company’s head offi ce in Bondi Beach, NSW, Australia.<br />
Business Segment Type of products and services<br />
Surf Life Saving Activities Administration of lifesaving and development and organisation of competitions<br />
Helicopter Rescue Service Delivery and provision of search and rescue and aero medical services<br />
(b) Primary Reporting Business Segments<br />
Revenue<br />
Surf Life Saving Activities Helicopter Rescue Service Consolidated<br />
2008<br />
$<br />
2007<br />
$<br />
External Sales 432,549 428,783 – – 432,549 428,783<br />
Other External Revenue 17,742,427 17,595,002 9,150,367 9,649,793 26,892,794 27,244,795<br />
Intersegment Revenue 185,896 – – – 185,896 –<br />
Total 18,360,872 18,023,785 9,150,367 9,649,793 27,511,239 27,673,578<br />
Eliminations (185,896) – – – (185,896) –<br />
Total Revenue 18,174,976 18,023,785 9,150,367 9,649,793 27,325,343 27,673,578<br />
Result<br />
Segment Result (204,302) 825,254 2,411,007 2,037,102 2,206,705 2,862,356<br />
Borrowing Costs – – (30,569) (53,070) (30,569) (53,070)<br />
Assets<br />
2008<br />
$<br />
2007<br />
$<br />
2008<br />
$<br />
2007<br />
$<br />
(204,302) 825,254 2,380,438 1,984,032 2,176,136 2,809,286<br />
Segment Assets 14,175,598 14,532,137 18,217,834 17,421,427 32,393,432 31,953,564<br />
Liabilities<br />
Segment Liabilities 7,779,979 8,126,754 1,007,313 1,993,240 8,787,292 10,119,994<br />
Other Information<br />
Depreciation and amortisation 212,960 185,867 1,194,662 1,477,249 1,407,622 1,663,116<br />
Non-cash expenses other than<br />
Depreciation and amortisation<br />
54,631 (25,851) (251,195) (122,926) (196,564) (148,777)<br />
Acquisition of Non Current Assets 115,222 419,538 1,096,072 4,243,515 1,211,294 4,663,053<br />
Intersegment Transfers<br />
Segment revenues, expenses and results include transfers between segments. The prices charged<br />
on intersegment transactions are the same as those charged for similar goods to parties outside of<br />
the consolidated group at an arms length. These transfers are eliminated on consolidation.<br />
86 <strong>SURF</strong> <strong>LIFE</strong> <strong>SAVING</strong> <strong>AUSTRALIA</strong>—<strong>ANNUAL</strong> <strong>REPORT</strong> <strong>2007–08</strong>


