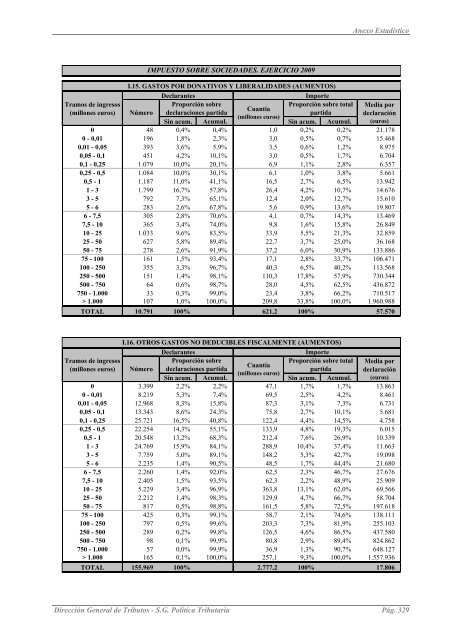
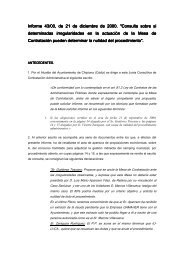
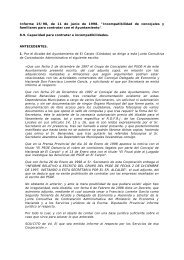
<strong>IMPUESTO</strong> <strong>SOBRE</strong> <strong>SOCIEDADES</strong>. EJERCICIO <strong>2009</strong> Anexo Estadístico I.15. GASTOS POR DONATIVOS Y LIBERALIDADES (AUM<strong>EN</strong>TOS) Declarantes Importe Tramos de ingresos (millones euros) Número Proporción sobre declaraciones partida Sin acum. Acumul. Cuantía (millones euros) Proporción sobre total partida Sin acum. Acumul. Media por declaración (euros) 0 48 0,4% 0,4% 1,0 0,2% 0,2% 21.178 0 - 0,01 196 1,8% 2,3% 3,0 0,5% 0,7% 15.468 0,01 - 0,05 393 3,6% 5,9% 3,5 0,6% 1,2% 8.975 0,05 - 0,1 451 4,2% 10,1% 3,0 0,5% 1,7% 6.704 0,1 - 0,25 1.079 10,0% 20,1% 6,9 1,1% 2,8% 6.357 0,25 - 0,5 1.084 10,0% 30,1% 6,1 1,0% 3,8% 5.661 0,5 - 1 1.187 11,0% 41,1% 16,5 2,7% 6,5% 13.942 1 - 3 1.799 16,7% 57,8% 26,4 4,2% 10,7% 14.676 3 - 5 792 7,3% 65,1% 12,4 2,0% 12,7% 15.610 5 - 6 283 2,6% 67,8% 5,6 0,9% 13,6% 19.807 6 - 7,5 305 2,8% 70,6% 4,1 0,7% 14,3% 13.469 7,5 - 10 365 3,4% 74,0% 9,8 1,6% 15,8% 26.849 10 - 25 1.033 9,6% 83,5% 33,9 5,5% 21,3% 32.859 25 - 50 627 5,8% 89,4% 22,7 3,7% 25,0% 36.168 50 - 75 278 2,6% 91,9% 37,2 6,0% 30,9% 133.886 75 - 100 161 1,5% 93,4% 17,1 2,8% 33,7% 106.471 100 - 250 355 3,3% 96,7% 40,3 6,5% 40,2% 113.568 250 - 500 151 1,4% 98,1% 110,3 17,8% 57,9% 730.344 500 - 750 64 0,6% 98,7% 28,0 4,5% 62,5% 436.872 750 - 1.000 33 0,3% 99,0% 23,4 3,8% 66,2% 710.517 > 1.000 107 1,0% 100,0% 209,8 33,8% 100,0% 1.960.988 TOTAL 10.791 100% 621,2 100% 57.570 I.16. OTROS GASTOS NO DEDUCIBLES FISCALM<strong>EN</strong>TE (AUM<strong>EN</strong>TOS) Declarantes Importe Tramos de ingresos (millones euros) Número Proporción sobre declaraciones partida Sin acum. Acumul. Cuantía (millones euros) Proporción sobre total partida Sin acum. Acumul. Media por declaración (euros) 0 3.399 2,2% 2,2% 47,1 1,7% 1,7% 13.863 0 - 0,01 8.219 5,3% 7,4% 69,5 2,5% 4,2% 8.461 0,01 - 0,05 12.968 8,3% 15,8% 87,3 3,1% 7,3% 6.731 0,05 - 0,1 13.343 8,6% 24,3% 75,8 2,7% 10,1% 5.681 0,1 - 0,25 25.721 16,5% 40,8% 122,4 4,4% 14,5% 4.758 0,25 - 0,5 22.254 14,3% 55,1% 133,9 4,8% 19,3% 6.015 0,5 - 1 20.548 13,2% 68,3% 212,4 7,6% 26,9% 10.339 1 - 3 24.769 15,9% 84,1% 288,9 10,4% 37,4% 11.663 3 - 5 7.759 5,0% 89,1% 148,2 5,3% 42,7% 19.098 5 - 6 2.235 1,4% 90,5% 48,5 1,7% 44,4% 21.680 6 - 7,5 2.260 1,4% 92,0% 62,5 2,3% 46,7% 27.676 7,5 - 10 2.405 1,5% 93,5% 62,3 2,2% 48,9% 25.909 10 - 25 5.229 3,4% 96,9% 363,8 13,1% 62,0% 69.566 25 - 50 2.212 1,4% 98,3% 129,9 4,7% 66,7% 58.704 50 - 75 817 0,5% 98,8% 161,5 5,8% 72,5% 197.618 75 - 100 425 0,3% 99,1% 58,7 2,1% 74,6% 138.111 100 - 250 797 0,5% 99,6% 203,3 7,3% 81,9% 255.103 250 - 500 289 0,2% 99,8% 126,5 4,6% 86,5% 437.580 500 - 750 98 0,1% 99,9% 80,8 2,9% 89,4% 824.862 750 - 1.000 57 0,0% 99,9% 36,9 1,3% 90,7% 648.127 > 1.000 165 0,1% 100,0% 257,1 9,3% 100,0% 1.557.936 TOTAL 155.969 100% 2.777,2 100% 17.806 Dirección General de Tributos - S.G. Política Tributaria Pág. 329
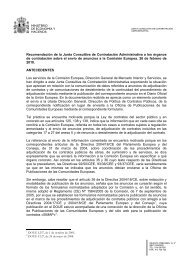
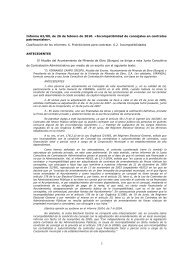
Ajustes extracontables <strong>IMPUESTO</strong> <strong>SOBRE</strong> <strong>SOCIEDADES</strong>. EJERCICIO <strong>2009</strong> I.17. REVALORIZACIONES CONTABLES (AUM<strong>EN</strong>TOS) Declarantes Importe Tramos de ingresos (millones euros) Número Proporción sobre declaraciones partida Sin acum. Acumul. Cuantía (millones euros) Proporción sobre total partida Sin acum. Acumul. Media por declaración (euros) 0 8 2,0% 2,0% 0,1 0,0% 0,0% 10.259 0 - 0,01 16 4,0% 6,0% 2,1 0,8% 0,8% 131.574 0,01 - 0,05 25 6,3% 12,3% 1,0 0,4% 1,2% 39.241 0,05 - 0,1 20 5,0% 17,3% 0,5 0,2% 1,3% 23.893 0,1 - 0,25 44 11,0% 28,3% 5,9 2,1% 3,5% 133.449 0,25 - 0,5 40 10,0% 38,3% 2,2 0,8% 4,3% 54.522 0,5 - 1 40 10,0% 48,4% 7,5 2,7% 7,0% 187.325 1 - 3 55 13,8% 62,2% 6,5 2,4% 9,3% 117.915 3 - 5 20 5,0% 67,2% 0,5 0,2% 9,5% 23.386 5 - 6 6 1,5% 68,7% 0,5 0,2% 9,7% 81.050 6 - 7,5 12 3,0% 71,7% 2,3 0,8% 10,5% 193.372 7,5 - 10 13 3,3% 74,9% 4,1 1,5% 12,0% 314.559 10 - 25 27 6,8% 81,7% 24,2 8,8% 20,8% 897.342 25 - 50 14 3,5% 85,2% 11,8 4,3% 25,1% 840.476 50 - 75 11 2,8% 88,0% 2,0 0,7% 25,8% 183.473 75 - 100 8 2,0% 90,0% 1,3 0,5% 26,3% 164.165 100 - 250 15 3,8% 93,7% 168,2 61,2% 87,5% 11.214.788 250 - 500 7 1,8% 95,5% 2,7 1,0% 88,5% 387.890 500 - 750 s.e. s.e. s.e. s.e. s.e. s.e. s.e. 750 - 1.000 s.e. s.e. s.e. s.e. s.e. s.e. s.e. > 1.000 9 2,3% 100,0% 18,9 6,9% 100,0% 2.098.639 TOTAL 399 100% 274,9 100% 689.002 s.e.: secreto estadístico Pág. 330 Dirección General de Tributos - S.G. Política Tributaria
- Page 1 and 2:
EL IMPUESTO SOBRE SOCIEDADES EN 200
- Page 3 and 4:
EL IMPUESTO SOBRE SOCIEDADES EN 200
- Page 5 and 6:
Presentación conforme a una agrupa
- Page 7 and 8:
Sumario V. DISTRIBUCIÓN POR AGRUPA
- Page 9 and 10:
Índice de cuadros Cuadro Página 2
- Page 12:
ÍNDICE DE GRÁFICOS El Impuesto so
- Page 16 and 17:
El Impuesto sobre Sociedades en 200
- Page 18:
El Impuesto sobre Sociedades en 200
- Page 22 and 23:
El Impuesto sobre Sociedades en 200
- Page 24 and 25:
El Impuesto sobre Sociedades en 200
- Page 26 and 27:
• Libertad de amortización con m
- Page 28 and 29:
• Rentas exentas de las SOCIMI El
- Page 30 and 31:
El Impuesto sobre Sociedades en 200
- Page 32 and 33:
El Impuesto sobre Sociedades en 200
- Page 34 and 35:
El Impuesto sobre Sociedades en 200
- Page 36 and 37:
• Tipos de gravamen de las SOCIMI
- Page 38 and 39:
El Impuesto sobre Sociedades en 200
- Page 40 and 41:
El Impuesto sobre Sociedades en 200
- Page 42 and 43:
El Impuesto sobre Sociedades en 200
- Page 44 and 45:
El Impuesto sobre Sociedades en 200
- Page 46 and 47:
El Impuesto sobre Sociedades en 200
- Page 48 and 49:
El Impuesto sobre Sociedades en 200
- Page 50 and 51:
El Impuesto sobre Sociedades en 200
- Page 52 and 53:
El Impuesto sobre Sociedades en 200
- Page 54 and 55:
El Impuesto sobre Sociedades en 200
- Page 56 and 57:
El Impuesto sobre Sociedades en 200
- Page 58 and 59:
El Impuesto sobre Sociedades en 200
- Page 60 and 61:
El Impuesto sobre Sociedades en 200
- Page 62:
El Impuesto sobre Sociedades en 200
- Page 66 and 67:
El Impuesto sobre Sociedades en 200
- Page 68 and 69:
- Los fondos de capital-riesgo. - L
- Page 70 and 71:
El Impuesto sobre Sociedades en 200
- Page 72 and 73:
El Impuesto sobre Sociedades en 200
- Page 74 and 75:
El régimen especial de las ERD con
- Page 76 and 77:
El Impuesto sobre Sociedades en 200
- Page 78 and 79:
El Impuesto sobre Sociedades en 200
- Page 80 and 81:
El Impuesto sobre Sociedades en 200
- Page 82 and 83:
El Impuesto sobre Sociedades en 200
- Page 84 and 85:
El Impuesto sobre Sociedades en 200
- Page 86 and 87:
El Impuesto sobre Sociedades en 200
- Page 88 and 89:
El Impuesto sobre Sociedades en 200
- Page 90 and 91:
III.2. Balance y cuenta de resultad
- Page 92 and 93:
El Impuesto sobre Sociedades en 200
- Page 94 and 95:
El Impuesto sobre Sociedades en 200
- Page 96 and 97:
El Impuesto sobre Sociedades en 200
- Page 98 and 99:
El Impuesto sobre Sociedades en 200
- Page 100 and 101:
El Impuesto sobre Sociedades en 200
- Page 102 and 103:
El Impuesto sobre Sociedades en 200
- Page 104 and 105:
Partida Dirección General de Tribu
- Page 106 and 107:
Cuadro 8 ENTIDADES DE CRÉDITO. IS
- Page 108 and 109:
Dirección General de Tributos - S.
- Page 110 and 111:
Cuadro 10 ENTIDADES ASEGURADORAS. I
- Page 112 and 113:
El Impuesto sobre Sociedades en 200
- Page 114 and 115:
El Impuesto sobre Sociedades en 200
- Page 116 and 117:
El Impuesto sobre Sociedades en 200
- Page 118 and 119:
Dirección General de Tributos - S.
- Page 120 and 121:
Cuadro 14 SOCIEDADES DE GARANTÍA R
- Page 122 and 123:
El Impuesto sobre Sociedades en 200
- Page 124 and 125:
III.3. Resultado contable y ajustes
- Page 126 and 127:
El Impuesto sobre Sociedades en 200
- Page 128 and 129:
El Impuesto sobre Sociedades en 200
- Page 130 and 131:
El Impuesto sobre Sociedades en 200
- Page 132 and 133:
El Impuesto sobre Sociedades en 200
- Page 134 and 135:
− Otras provisiones no deducibles
- Page 136 and 137:
El Impuesto sobre Sociedades en 200
- Page 138 and 139:
Cuadro 20 (continuación) AJUSTES A
- Page 140 and 141:
El Impuesto sobre Sociedades en 200
- Page 142 and 143:
Dirección General de Tributos - S.
- Page 144 and 145:
El Impuesto sobre Sociedades en 200
- Page 146 and 147:
Exenciones doble imp. internacional
- Page 148 and 149:
El Impuesto sobre Sociedades en 200
- Page 150 and 151:
El Impuesto sobre Sociedades en 200
- Page 152 and 153:
El Impuesto sobre Sociedades en 200
- Page 154 and 155:
El Impuesto sobre Sociedades en 200
- Page 156 and 157:
III.4. Base imponible El Impuesto s
- Page 158 and 159:
Tramos de ingresos (millones de eur
- Page 160 and 161:
El Impuesto sobre Sociedades en 200
- Page 162 and 163:
El Impuesto sobre Sociedades en 200
- Page 164:
El Impuesto sobre Sociedades en 200
- Page 167 and 168:
Análisis de los datos estadístico
- Page 169 and 170:
Análisis de los datos estadístico
- Page 171 and 172:
Análisis de los datos estadístico
- Page 173 and 174:
Análisis de los datos estadístico
- Page 175 and 176:
Análisis de los datos estadístico
- Page 177 and 178:
Análisis de los datos estadístico
- Page 179 and 180:
Análisis de los datos estadístico
- Page 181 and 182:
Análisis de los datos estadístico
- Page 183 and 184:
Análisis de los datos estadístico
- Page 185 and 186:
Análisis de los datos estadístico
- Page 187 and 188:
Análisis de los datos estadístico
- Page 189 and 190:
Análisis de los datos estadístico
- Page 191 and 192:
Análisis de los datos estadístico
- Page 193 and 194:
Análisis de los datos estadístico
- Page 195 and 196:
Análisis de los datos estadístico
- Page 197 and 198:
Análisis de los datos estadístico
- Page 199 and 200:
Análisis de los datos estadístico
- Page 201 and 202:
Análisis de los datos estadístico
- Page 203 and 204:
Análisis de los datos estadístico
- Page 205 and 206:
Análisis de los datos estadístico
- Page 207 and 208:
Análisis de los datos estadístico
- Page 209 and 210:
Análisis de los datos estadístico
- Page 211 and 212:
Análisis de los datos estadístico
- Page 213 and 214:
Análisis de los datos estadístico
- Page 215 and 216:
Análisis de los datos estadístico
- Page 217 and 218:
Análisis de los datos estadístico
- Page 219 and 220:
Análisis de los datos estadístico
- Page 221 and 222:
Análisis de los datos estadístico
- Page 223 and 224:
Análisis de los datos estadístico
- Page 225 and 226:
Análisis de los datos estadístico
- Page 227 and 228:
Análisis de los datos estadístico
- Page 229 and 230:
Análisis de los datos estadístico
- Page 231 and 232:
Análisis de los datos estadístico
- Page 233 and 234:
Análisis de los datos estadístico
- Page 235 and 236:
Análisis de los datos estadístico
- Page 237 and 238:
Análisis de los datos estadístico
- Page 240 and 241:
III.9. Cuota diferencial El Impuest
- Page 242:
IV. RÉGIMEN ESPECIAL DE LAS EMPRES
- Page 245 and 246:
Régimen especial de las empresas d
- Page 247 and 248:
Régimen especial de las empresas d
- Page 249 and 250:
Régimen especial de las empresas d
- Page 251 and 252:
Régimen especial de las empresas d
- Page 253 and 254:
Régimen especial de las empresas d
- Page 255 and 256:
Régimen especial de las empresas d
- Page 257 and 258:
Régimen especial de las empresas d
- Page 259 and 260:
Régimen especial de las empresas d
- Page 261 and 262:
Régimen especial de las empresas d
- Page 263 and 264:
Régimen especial de las empresas d
- Page 265 and 266:
Régimen especial de las empresas d
- Page 267 and 268:
Régimen especial de las empresas d
- Page 269 and 270:
Régimen especial de las empresas d
- Page 272 and 273:
El Impuesto sobre Sociedades en 200
- Page 274 and 275:
Variable Transportes y comunicacion
- Page 276 and 277:
El Impuesto sobre Sociedades en 200
- Page 278 and 279:
El Impuesto sobre Sociedades en 200
- Page 280 and 281:
Gráfico 16 ESTRUCTURAS DE LA BASE
- Page 282 and 283:
Agrupaciones de sectores Dirección
- Page 284 and 285:
El Impuesto sobre Sociedades en 200
- Page 286:
VI. DISTRIBUCIÓN POR TIPOS DE GRAV
- Page 289 and 290:
Distribución por tipos de gravamen
- Page 291 and 292: Distribución por tipos de gravamen
- Page 293 and 294: Distribución por tipos de gravamen
- Page 295 and 296: Distribución por tipos de gravamen
- Page 298: VII. CONCLUSIONES
- Page 301 and 302: Conclusiones Gráfico 19 (continuac
- Page 303 and 304: Conclusiones Variable Cuadro 49 PRI
- Page 305 and 306: Conclusiones • El valor de la “
- Page 307 and 308: Conclusiones adicional undécima de
- Page 309 and 310: Conclusiones De forma análoga a lo
- Page 311 and 312: Conclusiones notable caída fueron:
- Page 313 and 314: Conclusiones -23,4% respecto a 2009
- Page 316: El Impuesto sobre Sociedades en 200
- Page 320 and 321: ÍNDICE DE CUADROS Anexo Estadísti
- Page 322 and 323: Anexo Estadístico Cuadro Página I
- Page 324: Anexo Estadístico Cuadro Página I
- Page 328 and 329: IMPUESTO SOBRE SOCIEDADES. EJERCICI
- Page 330 and 331: IMPUESTO SOBRE SOCIEDADES. EJERCICI
- Page 332 and 333: IMPUESTO SOBRE SOCIEDADES. EJERCICI
- Page 334 and 335: IMPUESTO SOBRE SOCIEDADES. EJERCICI
- Page 336 and 337: IMPUESTO SOBRE SOCIEDADES. EJERCICI
- Page 338 and 339: IMPUESTO SOBRE SOCIEDADES. EJERCICI
- Page 340 and 341: IMPUESTO SOBRE SOCIEDADES. EJERCICI
- Page 344 and 345: IMPUESTO SOBRE SOCIEDADES. EJERCICI
- Page 346 and 347: IMPUESTO SOBRE SOCIEDADES. EJERCICI
- Page 348 and 349: IMPUESTO SOBRE SOCIEDADES. EJERCICI
- Page 350 and 351: IMPUESTO SOBRE SOCIEDADES. EJERCICI
- Page 352 and 353: IMPUESTO SOBRE SOCIEDADES. EJERCICI
- Page 354 and 355: IMPUESTO SOBRE SOCIEDADES. EJERCICI
- Page 356 and 357: IMPUESTO SOBRE SOCIEDADES. EJERCICI
- Page 358 and 359: IMPUESTO SOBRE SOCIEDADES. EJERCICI
- Page 360: IMPUESTO SOBRE SOCIEDADES. EJERCICI
- Page 364: IMPUESTO SOBRE SOCIEDADES. EJERCICI
- Page 368 and 369: IMPUESTO SOBRE SOCIEDADES. EJERCICI
- Page 370: IV. DEDUCCIONES POR DOBLE IMPOSICI
- Page 374 and 375: IMPUESTO SOBRE SOCIEDADES. EJERCICI
- Page 376: IV.2. Deducciones por doble imposic
- Page 379 and 380: Deducciones por doble imposición I
- Page 382 and 383: IMPUESTO SOBRE SOCIEDADES. EJERCICI
- Page 384: V. DEDUCCIONES POR INVERSIONES Y CR
- Page 387 and 388: Deducciones por inversiones y creac
- Page 390: VI. PAGOS A CUENTA. IS 2009
- Page 393 and 394:
Pagos a cuenta IMPUESTO SOBRE SOCIE
- Page 396 and 397:
IMPUESTO SOBRE SOCIEDADES. EJERCICI
- Page 398 and 399:
IMPUESTO SOBRE SOCIEDADES. EJERCICI
- Page 400:
IMPUESTO SOBRE SOCIEDADES. EJERCICI
- Page 404 and 405:
IMPUESTO SOBRE SOCIEDADES. EJERCICI
- Page 406:
IMPUESTO SOBRE SOCIEDADES. EJERCICI
- Page 410:
IX.1. Actividades agrícolas, ganad
- Page 413 and 414:
Ajustes extracontables y minoracion
- Page 416 and 417:
IMPUESTO SOBRE SOCIEDADES. EJERCICI
- Page 418:
IX.3. Industria
- Page 421 and 422:
Ajustes extracontables y minoracion
- Page 424 and 425:
IMPUESTO SOBRE SOCIEDADES. EJERCICI
- Page 426:
IX.5. Comercio y reparaciones
- Page 429 and 430:
Ajustes extracontables y minoracion
- Page 432 and 433:
IMPUESTO SOBRE SOCIEDADES. EJERCICI
- Page 434:
IX.7. Transporte y comunicaciones
- Page 437 and 438:
Ajustes extracontables y minoracion
- Page 440 and 441:
Concepto IMPUESTO SOBRE SOCIEDADES.
- Page 442:
IX.9. Servicios a las empresas (exc
- Page 445 and 446:
Ajustes extracontables y minoracion
- Page 448 and 449:
IMPUESTO SOBRE SOCIEDADES. EJERCICI
- Page 450:
IX.11. Alquileres inmobiliarios
- Page 453 and 454:
Ajustes extracontables y minoracion
- Page 456 and 457:
IMPUESTO SOBRE SOCIEDADES. EJERCICI
- Page 458:
IX.13. No clasificados
- Page 461:
Ajustes extracontables y minoracion