Guia para estudiar Patrones de Distribución de Especies
Guia para estudiar Patrones de Distribución de Especies
Guia para estudiar Patrones de Distribución de Especies

Create successful ePaper yourself
Turn your PDF publications into a flip-book with our unique Google optimized e-Paper software.
34<br />
<strong>Guia</strong> <strong>para</strong> <strong>estudiar</strong> <strong>Patrones</strong> <strong>de</strong> <strong>Distribución</strong> <strong>de</strong> <strong>Especies</strong> Amazónicas<br />
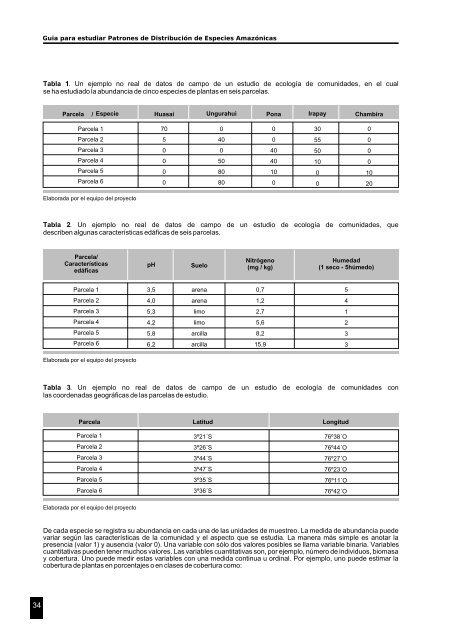
Tabla 1. Un ejemplo no real <strong>de</strong> datos <strong>de</strong> campo <strong>de</strong> un estudio <strong>de</strong> ecología <strong>de</strong> comunida<strong>de</strong>s, en el cual<br />
se ha estudiado la abundancia <strong>de</strong> cinco especies <strong>de</strong> plantas en seis parcelas.<br />
Parcela / Especie Huasai Ungurahui Pona Irapay Chambira<br />
Parcela 1<br />
Parcela 2<br />
Parcela 3<br />
Parcela 4<br />
Parcela 5<br />
Parcela 6<br />
Elaborada por el equipo <strong>de</strong>l proyecto<br />
Parcela/<br />
Características<br />
edáficas<br />
Parcela 1<br />
Parcela 2<br />
Parcela 3<br />
Parcela 4<br />
Parcela 5<br />
Parcela 6<br />
Parcela Latitud<br />
Parcela 1<br />
Parcela 2<br />
Parcela 3<br />
Parcela 4<br />
Parcela 5<br />
Parcela 6<br />
pH Suelo<br />
3,5<br />
4,0<br />
5,3<br />
4,2<br />
5,8<br />
6,2<br />
70<br />
5<br />
0<br />
0<br />
0<br />
0<br />
arena<br />
arena<br />
limo<br />
limo<br />
arcilla<br />
arcilla<br />
3º21´S<br />
3º26´S<br />
3º44´S<br />
3º47´S<br />
3º35´S<br />
3º36´S<br />
0<br />
40<br />
0<br />
50<br />
80<br />
80<br />
Tabla 2. Un ejemplo no real <strong>de</strong> datos <strong>de</strong> campo <strong>de</strong> un estudio <strong>de</strong> ecología <strong>de</strong> comunida<strong>de</strong>s, que<br />
<strong>de</strong>scriben algunas características edáficas <strong>de</strong> seis parcelas.<br />
Elaborada por el equipo <strong>de</strong>l proyecto<br />
Nitrógeno<br />
(mg / kg)<br />
Humedad<br />
(1 seco - 5húmedo)<br />
Tabla 3. Un ejemplo no real <strong>de</strong> datos <strong>de</strong> campo <strong>de</strong> un estudio <strong>de</strong> ecología <strong>de</strong> comunida<strong>de</strong>s con<br />
las coor<strong>de</strong>nadas geográficas <strong>de</strong> las parcelas <strong>de</strong> estudio.<br />
Elaborada por el equipo <strong>de</strong>l proyecto<br />
Longitud<br />
76º38´O<br />
76º44´O<br />
76º27´O<br />
76º23´O<br />
76º11´O<br />
76º42´O<br />
De cada especie se registra su abundancia en cada una <strong>de</strong> las unida<strong>de</strong>s <strong>de</strong> muestreo. La medida <strong>de</strong> abundancia pue<strong>de</strong><br />
variar según las características <strong>de</strong> la comunidad y el aspecto que se estudia. La manera más simple es anotar la<br />
presencia (valor 1) y ausencia (valor 0). Una variable con sólo dos valores posibles se llama variable binaria. Variables<br />
cuantitativas pue<strong>de</strong>n tener muchos valores. Las variables cuantitativas son, por ejemplo, número <strong>de</strong> individuos, biomasa<br />
y cobertura. Uno pue<strong>de</strong> medir estas variables con una medida continua u ordinal. Por ejemplo, uno pue<strong>de</strong> estimar la<br />
cobertura <strong>de</strong> plantas en porcentajes o en clases <strong>de</strong> cobertura como:<br />
0,7<br />
1,2<br />
2,7<br />
5,6<br />
8,2<br />
15,9<br />
0<br />
0<br />
40<br />
40<br />
10<br />
0<br />
30<br />
55<br />
50<br />
10<br />
0<br />
0<br />
5<br />
4<br />
1<br />
2<br />
3<br />
3<br />
0<br />
0<br />
0<br />
0<br />
10<br />
20