IV. II. Convivencia escolar y diversidad cultural. Estudio ... - Exedra
IV. II. Convivencia escolar y diversidad cultural. Estudio ... - Exedra
IV. II. Convivencia escolar y diversidad cultural. Estudio ... - Exedra

Create successful ePaper yourself
Turn your PDF publications into a flip-book with our unique Google optimized e-Paper software.
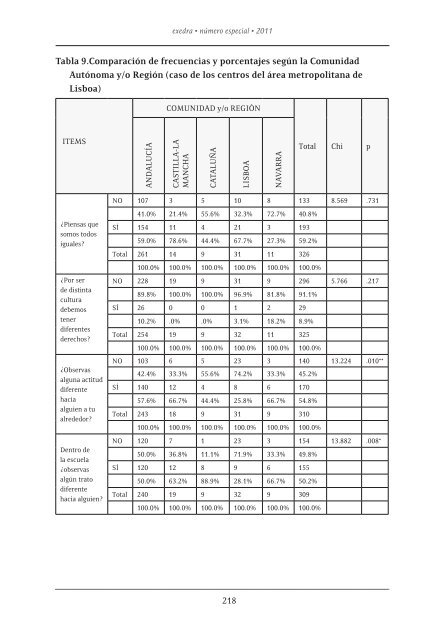
exedra • número especial • 2011Tabla 9.Comparación de frecuencias y porcentajes según la ComunidadAutónoma y/o Región (caso de los centros del área metropolitana deLisboa)COMUNIDAD y/o REGIÓNITEMSANDALUCÍACASTILLA-LAMANCHACATALUÑALISBOANAVARRATotal Chi pNO 107 3 5 10 8 133 8.569 .731¿Piensas quesomos todosiguales?41.0% 21.4% 55.6% 32.3% 72.7% 40.8%SÍ 154 11 4 21 3 19359.0% 78.6% 44.4% 67.7% 27.3% 59.2%Total 261 14 9 31 11 326100.0% 100.0% 100.0% 100.0% 100.0% 100.0%¿Por serde distintaculturadebemostenerdiferentesderechos?¿Observasalguna actituddiferentehaciaalguien a tualrededor?Dentro dela escuela¿observasalgún tratodiferentehacia alguien?NO 228 19 9 31 9 296 5.766 .21789.8% 100.0% 100.0% 96.9% 81.8% 91.1%SÍ 26 0 0 1 2 2910.2% .0% .0% 3.1% 18.2% 8.9%Total 254 19 9 32 11 325100.0% 100.0% 100.0% 100.0% 100.0% 100.0%NO 103 6 5 23 3 140 13.224 .010**42.4% 33.3% 55.6% 74.2% 33.3% 45.2%SÍ 140 12 4 8 6 17057.6% 66.7% 44.4% 25.8% 66.7% 54.8%Total 243 18 9 31 9 310100.0% 100.0% 100.0% 100.0% 100.0% 100.0%NO 120 7 1 23 3 154 13.882 .008*50.0% 36.8% 11.1% 71.9% 33.3% 49.8%SÍ 120 12 8 9 6 15550.0% 63.2% 88.9% 28.1% 66.7% 50.2%Total 240 19 9 32 9 309100.0% 100.0% 100.0% 100.0% 100.0% 100.0%218