

On peut toujours chercher - National Bank of Canada Advisor ...
On peut toujours chercher - National Bank of Canada Advisor ...
On peut toujours chercher - National Bank of Canada Advisor ...

You also want an ePaper? Increase the reach of your titles
YUMPU automatically turns print PDFs into web optimized ePapers that Google loves.
60<br />
MARCHÉ MONÉTAIRE<br />
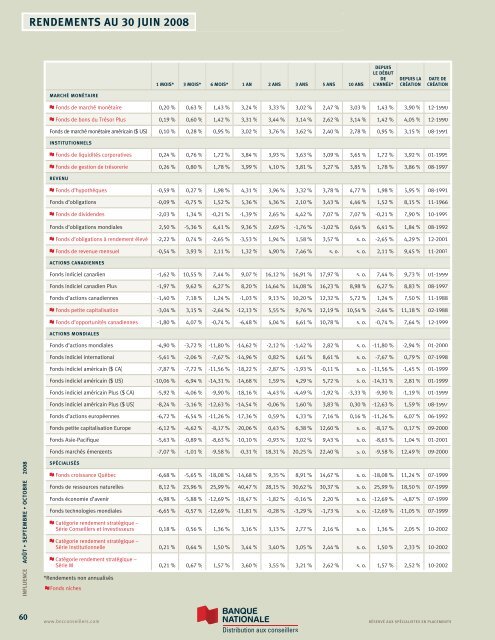
INFLUENCE AOÛT • SEPTEMBRE • OCTOBRE 2008 RENDEMENTS AU 30 JUIN 2008<br />
www.bncconseillers.com<br />
1 MOIS* 3 MOIS* 6 MOIS* 1 AN 2 ANS 3 ANS 5 ANS 10 ANS<br />
DEPUIS<br />
LE DÉBUT<br />
DE<br />
L’ANNÉE*<br />
DEPUIS LA<br />
CRÉATION<br />
DATE DE<br />
CRÉATION<br />
Fonds de marché monétaire 0,20 % 0,63 % 1,43 % 3,24 % 3,33 % 3,02 % 2,47 % 3,03 % 1,43 % 3,90 % 12-1990<br />
Fonds de bons du Trésor Plus 0,19 % 0,60 % 1,42 % 3,31 % 3,44 % 3,14 % 2,62 % 3,14 % 1,42 % 4,05 % 12-1990<br />
Fonds de marché monétaire américain ($ US) 0,10 % 0,28 % 0,95 % 3,02 % 3,76 % 3,62 % 2,40 % 2,78 % 0,95 % 3,15 % 08-1991<br />
INSTITUTIONNELS<br />
Fonds de liquidités corporatives 0,24 % 0,76 % 1,72 % 3,84 % 3,93 % 3,63 % 3,09 % 3,65 % 1,72 % 3,92 % 01-1995<br />
Fonds de gestion de trésorerie 0,26 % 0,80 % 1,78 % 3,99 % 4,10 % 3,81 % 3,27 % 3,85 % 1,78 % 3,86 % 08-1997<br />
REVENU<br />
Fonds d’hypothèques -0,59 % 0,27 % 1,98 % 4,31 % 3,96 % 3,32 % 3,78 % 4,77 % 1,98 % 5,95 % 08-1991<br />
Fonds d’obligations -0,09 % -0,75 % 1,52 % 5,36 % 4,36 % 2,10 % 3,43 % 4,46 % 1,52 % 8,15 % 11-1966<br />
Fonds de dividendes -2,03 % 1,34 % -0,21 % -1,39 % 2,65 % 4,42 % 7,07 % 7,07 % -0,21 % 7,90 % 10-1995<br />
Fonds d’obligations mondiales 2,50 % -5,36 % 6,41 % 9,36 % 2,69 % -1,76 % -1,02 % 0,64 % 6,41 % 1,84 % 08-1992<br />
Fonds d’obligations à rendement élevé -2,22 % 0,74 % -2,65 % -3,53 % 1,94 % 1,58 % 3,57 % s. o. -2,65 % 4,29 % 12-2001<br />
Fonds de revenue mensuel -0,54 % 3,93 % 2,11 % 1,32 % 4,90 % 7,46 % s. o. s. o. 2,11 % 9,45 % 11-2003<br />
ACTIONS CANADIENNES<br />
Fonds indiciel canadien -1,62 % 10,55 % 7,44 % 9,07 % 16,12 % 16,91 % 17,97 % s. o. 7,44 % 9,73 % 01-1999<br />
Fonds indiciel canadien Plus -1,97 % 9,62 % 6,27 % 8,20 % 14,64 % 14,08 % 16,23 % 8,98 % 6,27 % 8,83 % 08-1997<br />
Fonds d’actions canadiennes -1,40 % 7,18 % 1,24 % -1,03 % 9,13 % 10,20 % 12,32 % 5,72 % 1,24 % 7,50 % 11-1988<br />
Fonds petite capitalisation -3,04 % 3,15 % -2,64 % -12,13 % 5,55 % 9,76 % 12,19 % 10,54 % -2,64 % 11,18 % 02-1988<br />
Fonds d’opportunités canadiennes -1,80 % 4,07 % -0,74 % -6,48 % 6,04 % 6,61 % 10,78 % s. o. -0,74 % 7,64 % 12-1999<br />
ACTIONS MONDIALES<br />
Fonds d’actions mondiales -4,90 % -3,72 % -11,80 % -14,62 % -2,12 % -1,42 % 2,82 % s. o. -11,80 % -2,94 % 01-2000<br />
Fonds indiciel international -5,61 % -2,06 % -7,67 % -14,96 % 0,82 % 4,61 % 8,61 % s. o. -7,67 % 0,79 % 07-1998<br />
Fonds indiciel américain ($ CA) -7,87 % -7,72 % -11,56 % -18,22 % -2,87 % -1,93 % -0,11 % s. o. -11,56 % -1,45 % 01-1999<br />
Fonds indiciel américain ($ US) -10,06 % -6,94 % -14,31 % -14,68 % 1,59 % 4,29 % 5,72 % s. o. -14,31 % 2,81 % 01-1999<br />
Fonds indiciel américain Plus ($ CA) -5,92 % -4,06 % -9,90 % -18,16 % -4,43 % -4,49 % -1,92 % -3,33 % -9,90 % -1,19 % 01-1999<br />
Fonds indiciel américain Plus ($ US) -8,24 % -3,16 % -12,63 % -14,54 % -0,06 % 1,60 % 3,83 % 0,30 % -12,63 % 1,59 % 08-1997<br />
Fonds d’actions européennes -6,72 % -6,54 % -11,26 % -17,36 % 0,59 % 4,33 % 7,16 % 0,16 % -11,26 % 6,07 % 06-1992<br />
Fonds petite capitalisation Europe -6,12 % -4,62 % -8,17 % -20,06 % 0,43 % 6,38 % 12,60 % s. o. -8,17 % 0,17 % 09-2000<br />
Fonds Asie-Pacifique -5,63 % -0,89 % -8,63 % -10,10 % -0,93 % 3,02 % 9,43 % s. o. -8,63 % 1,04 % 01-2001<br />
Fonds marchés émergents -7,07 % -1,01 % -9,58 % -0,31 % 18,31 % 20,25 % 22,40 % s. o. -9,58 % 12,49 % 09-2000<br />
SPÉCIALISÉS<br />
Fonds croissance Québec -6,68 % -5,65 % -18,08 % -14,68 % 9,35 % 8,91 % 14,67 % s. o. -18,08 % 11,24 % 07-1999<br />
Fonds de ressources naturelles 8,12 % 23,96 % 25,99 % 40,47 % 28,15 % 30,62 % 30,37 % s. o. 25,99 % 18,50 % 07-1999<br />
Fonds économie d’avenir -6,98 % -5,88 % -12,69 % -18,47 % -1,82 % -0,16 % 2,20 % s. o. -12,69 % -4,87 % 07-1999<br />
Fonds technologies mondiales -6,65 % -0,57 % -12,69 % -11,81 % -0,28 % -3,29 % -1,73 % s. o. -12,69 % -11,05 % 07-1999<br />
Catégorie rendement stratégique –<br />
Série Conseillers et Investisseurs 0,18 % 0,56 % 1,36 % 3,16 % 3,13 % 2,77 % 2,16 % s. o. 1,36 % 2,05 % 10-2002<br />
Catégorie rendement stratégique –<br />
Série Institutionnelle 0,21 % 0,64 % 1,50 % 3,44 % 3,40 % 3,05 % 2,44 % s. o. 1,50 % 2,33 % 10-2002<br />
Catégorie rendement stratégique –<br />
Série M 0,21 % 0,67 % 1,57 % 3,60 % 3,55 % 3,21 % 2,62 % s. o. 1,57 % 2,52 % 10-2002<br />
*Rendements non annualisés<br />
Fonds niches<br />
RÉSERVÉ AUX SPÉCIALISTES EN PLACEMENTS