Vol. 35 – 2009 - Ecologia Mediterranea - Université d'Avignon et des ...
Vol. 35 – 2009 - Ecologia Mediterranea - Université d'Avignon et des ...
Vol. 35 – 2009 - Ecologia Mediterranea - Université d'Avignon et des ...

Create successful ePaper yourself
Turn your PDF publications into a flip-book with our unique Google optimized e-Paper software.
ecologia mediterranea <strong>–</strong> <strong>Vol</strong>. <strong>35</strong> <strong>–</strong> <strong>2009</strong><br />
Investigation on macrophyte development in Litani River (Lebanon) subjected to human disturbances<br />
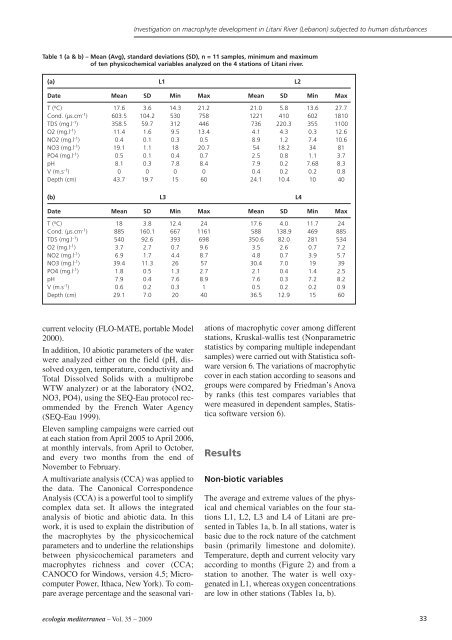
Table 1 (a & b) <strong>–</strong> Mean (Avg), standard deviations (SD), n = 11 samples, minimum and maximum<br />
of ten physicochemical variables analyzed on the 4 stations of Litani river.<br />
(a) L1 L2<br />
Date Mean SD Min Max Mean SD Min Max<br />
T ( o C) 17.6 3.6 14.3 21.2 21.0 5.8 13.6 27.7<br />
Cond. (µs.cm -1 ) 603.5 104.2 530 758 1221 410 602 1810<br />
TDS (mg.l -1 ) <strong>35</strong>8.5 59.7 312 446 736 220.3 <strong>35</strong>5 1100<br />
O2 (mg.l -1 ) 11.4 1.6 9.5 13.4 4.1 4.3 0.3 12.6<br />
NO2 (mg.l -1 ) 0.4 0.1 0.3 0.5 8.9 1.2 7.4 10.6<br />
NO3 (mg.l -1 ) 19.1 1.1 18 20.7 54 18.2 34 81<br />
PO4 (mg.l -1 ) 0.5 0.1 0.4 0.7 2.5 0.8 1.1 3.7<br />
pH 8.1 0.3 7.8 8.4 7.9 0.2 7.68 8.3<br />
V (m.s -1 ) 0 0 0 0 0.4 0.2 0.2 0.8<br />
Depth (cm) 43.7 19.7 15 60 24.1 10.4 10 40<br />
(b) L3 L4<br />
Date Mean SD Min Max Mean SD Min Max<br />
T ( o C) 18 3.8 12.4 24 17.6 4.0 11.7 24<br />
Cond. (µs.cm -1 ) 885 160.1 667 1161 588 138.9 469 885<br />
TDS (mg.l -1 ) 540 92.6 393 698 <strong>35</strong>0.6 82.0 281 534<br />
O2 (mg.l -1 ) 3.7 2.7 0.7 9.6 3.5 2.6 0.7 7.2<br />
NO2 (mg.l -1 ) 6.9 1.7 4.4 8.7 4.8 0.7 3.9 5.7<br />
NO3 (mg.l -1 ) 39.4 11.3 26 57 30.4 7.0 19 39<br />
PO4 (mg.l -1 ) 1.8 0.5 1.3 2.7 2.1 0.4 1.4 2.5<br />
pH 7.9 0.4 7.6 8.9 7.6 0.3 7.2 8.2<br />
V (m.s -1 ) 0.6 0.2 0.3 1 0.5 0.2 0.2 0.9<br />
Depth (cm) 29.1 7.0 20 40 36.5 12.9 15 60<br />
current velocity (FLO-MATE, portable Model<br />
2000).<br />
In addition, 10 abiotic param<strong>et</strong>ers of the water<br />
were analyzed either on the field (pH, dissolved<br />
oxygen, temperature, conductivity and<br />
Total Dissolved Solids with a multiprobe<br />
WTW analyzer) or at the laboratory (NO2,<br />
NO3, PO4), using the SEQ-Eau protocol recommended<br />
by the French Water Agency<br />
(SEQ-Eau 1999).<br />
Eleven sampling campaigns were carried out<br />
at each station from April 2005 to April 2006,<br />
at monthly intervals, from April to October,<br />
and every two months from the end of<br />
November to February.<br />
A multivariate analysis (CCA) was applied to<br />
the data. The Canonical Correspondence<br />
Analysis (CCA) is a powerful tool to simplify<br />
complex data s<strong>et</strong>. It allows the integrated<br />
analysis of biotic and abiotic data. In this<br />
work, it is used to explain the distribution of<br />
the macrophytes by the physicochemical<br />
param<strong>et</strong>ers and to underline the relationships<br />
b<strong>et</strong>ween physicochemical param<strong>et</strong>ers and<br />
macrophytes richness and cover (CCA;<br />
CANOCO for Windows, version 4.5; Microcomputer<br />
Power, Ithaca, New York). To compare<br />
average percentage and the seasonal vari-<br />
ations of macrophytic cover among different<br />
stations, Kruskal-wallis test (Nonparam<strong>et</strong>ric<br />
statistics by comparing multiple independant<br />
samples) were carried out with Statistica software<br />
version 6. The variations of macrophytic<br />
cover in each station according to seasons and<br />
groups were compared by Friedman’s Anova<br />
by ranks (this test compares variables that<br />
were measured in dependent samples, Statistica<br />
software version 6).<br />
Results<br />
Non-biotic variables<br />
The average and extreme values of the physical<br />
and chemical variables on the four stations<br />
L1, L2, L3 and L4 of Litani are presented<br />
in Tables 1a, b. In all stations, water is<br />
basic due to the rock nature of the catchment<br />
basin (primarily limestone and dolomite).<br />
Temperature, depth and current velocity vary<br />
according to months (Figure 2) and from a<br />
station to another. The water is well oxygenated<br />
in L1, whereas oxygen concentrations<br />
are low in other stations (Tables 1a, b).<br />
33