RETAIL_2016

Create successful ePaper yourself
Turn your PDF publications into a flip-book with our unique Google optimized e-Paper software.
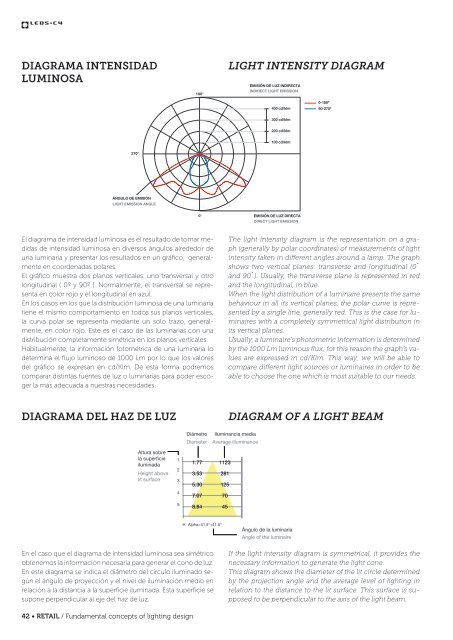
DIAGRAMA INTENSIDAD<br />
LUMINOSA<br />
180°<br />
LIGHT INTENSITY DIAGRAM<br />
EMISIÓN DE LUZ INDIRECTA<br />
INDIRECT LIGHT EMISSION<br />
400 cd/klm<br />
0-180º<br />
90-270º<br />
300 cd/klm<br />
200 cd/klm<br />
100 cd/klm<br />
270°<br />
ÁNGULO DE EMISIÓN<br />
LIGHT EMISSION ANGLE<br />
0°<br />
EMISIÓN DE LUZ DIRECTA<br />
DIRECT LIGHT EMISSION<br />
El diagrama de intensidad luminosa es el resultado de tomar medidas<br />
de intensidad luminosa en diversos ángulos alrededor de<br />
una luminaria y presentar los resultados en un gráfico, generalmente<br />
en coordenadas polares.<br />
El gráfico muestra dos planos verticales: uno transversal y otro<br />
longitudinal ( 0º y 90º ). Normalmente, el transversal se representa<br />
en color rojo y el longitudinal en azul.<br />
En los casos en los que la distribución luminosa de una luminaria<br />
tiene el mismo comportamiento en todos sus planos verticales,<br />
la curva polar se representa mediante un solo trazo, generalmente,<br />
en color rojo. Este es el caso de las luminarias con una<br />
distribución completamente simétrica en los planos verticales.<br />
Habitualmente, la información fotométrica de una luminaria lo<br />
determina el flujo luminoso de 1000 Lm por lo que los valores<br />
del gráfico se expresan en cd/Klm. De esta forma podremos<br />
comparar distintas fuentes de luz o luminarias para poder escoger<br />
la más adecuada a nuestras necesidades.<br />
The light intensity diagram is the representation on a graph<br />
(generally by polar coordinates) of measurements of light<br />
intensity taken in different angles around a lamp. The graph<br />
shows two vertical planes: transverse and longitudinal (0˚<br />
and 90˚). Usually, the transverse plane is represented in red<br />
and the longitudinal, in blue.<br />
When the light distribution of a luminaire presents the same<br />
behaviour in all its vertical planes, the polar curve is represented<br />
by a single line, generally red. This is the case for luminaires<br />
with a completely symmetrical light distribution in<br />
its vertical planes.<br />
Usually, a luminaire’s photometric information is determined<br />
by the 1000 Lm luminous flux; for this reason the graph’s values<br />
are expressed in cd/Klm. This way, we will be able to<br />
compare different light sources or luminaires in order to be<br />
able to choose the one which is most suitable to our needs.<br />
DIAGRAMA DEL HAZ DE LUZ<br />
DIAGRAM OF A LIGHT BEAM<br />
Diámetro<br />
Diameter<br />
Iluminancia media<br />
Average illuminance<br />
Altura sobre<br />
la superficie<br />
iluminada<br />
Height above<br />
lit surface<br />
1<br />
2<br />
3<br />
1.77<br />
3.53<br />
5.30<br />
1123<br />
281<br />
125<br />
4<br />
7.07<br />
70<br />
5<br />
8.84<br />
45<br />
H Alpha=41.5°+41.5°<br />
Ángulo de la luminaria<br />
Angle of the luminaire<br />
En el caso que el diagrama de intensidad luminosa sea simétrico<br />
obtenemos la información necesaria para generar el cono de luz.<br />
En este diagrama se indica el diámetro del círculo iluminado según<br />
el ángulo de proyección y el nivel de iluminación medio en<br />
relación a la distancia a la superficie iluminada. Esta superficie se<br />
supone perpendicular al eje del haz de luz.<br />
If the light intensity diagram is symmetrical, it provides the<br />
necessary information to generate the light cone.<br />
This diagram shows the diameter of the lit circle determined<br />
by the projection angle and the average level of lighting in<br />
relation to the distance to the lit surface. This surface is supposed<br />
to be perpendicular to the axis of the light beam.<br />
42 • <strong>RETAIL</strong> / Fundamental concepts of lighting design