Fresh Point Magazine - B2B24 - Il Sole 24 Ore
Fresh Point Magazine - B2B24 - Il Sole 24 Ore
Fresh Point Magazine - B2B24 - Il Sole 24 Ore

Create successful ePaper yourself
Turn your PDF publications into a flip-book with our unique Google optimized e-Paper software.
The big southern-hemisphere producers are Chile and<br />
the RSA, followed by Argentina, Peru, India and Namibia.<br />
Import and export in EU countries<br />
Overall EU imports exceed 1.5 million tons a year and,<br />
although a slight dip in trade volumes occurred in<br />
2009 and 2010 owing to a slide in demand and a rise<br />
in average list price, the overall trend keeps rising.<br />
While most of the table grape for EU consumers – about<br />
a million tons – is produced by Italy, Spain and Greece,<br />
imports also account for a considerable amount, registering<br />
over the last few years more than 600 thousand<br />
tons for a bill of more than a €1 billion (fig. 3).<br />
The EU’s leading table-grape exporters are the<br />
Netherlands and Germany, countries that are reexporters<br />
but not actual producers. For example,<br />
Holland re-exports during winter and spring because<br />
it imports from non-European producers.<br />
Intra-EU trade occurs mostly from July to December<br />
whereas the supply from October to June is imported<br />
from the usual southern-hemisphere producers.<br />
EU imports start in October from Brazil and extend<br />
through June from the RSA, Argentina, Chile and<br />
India, with the RSA and Chile combining to account<br />
for nearly 60% of the import volumes (fig. 4).<br />
EU imports from non-Union producers grew at an<br />
average 2.9% from 2005 to 2010. The suppliers<br />
è il principale produttore europeo di uve da tavola con<br />
circa 2 milioni di tonnellate. Tra i grandi produttori dell’emisfero<br />
australe spiccano invece Cile e Sudafrica,<br />
seguiti da Argentina, Perù, India e Namibia.<br />
Import ed export nei Paesi Ue<br />
Le importazioni dei Paesi Ue superano gli 1,5 milioni di<br />
tonnellate. Negli ultimi dieci anni sono cresciute a un<br />
ritmo molto sostenuto anche se, nel 2009 e nel 2010, è<br />
stata registrata una lieve riduzione dei volumi, determinata<br />
dalla contrazione dell’offerta e dall’aumento dei<br />
listini medi del prodotto importato.<br />
La maggior parte di uva da tavola – circa un milione di tonnellate<br />
- viene dai produttori comunitari (Italia, Spagna e<br />
Grecia), ma anche le importazioni dai Paesi terzi sono rilevanti,<br />
e negli ultimi anni hanno superato le 600mila tonnellate,<br />
con una spesa di oltre 1.000 milioni di euro (fig. 3).<br />
Tra i principali esportatori europei figurano anche Paesi<br />
Bassi e Germania che non sono produttori di uve da<br />
tavola, ma che riesportano una quota significativa delle<br />
uve importate. In particolare, le esportazioni dei Paesi<br />
Bassi riguardano le uve di origine extraeuropea e quindi<br />
sono concentrate nei mesi invernali e primaverili.<br />
Gli scambi intracomunitari avvengono soprattutto tra luglio<br />
e dicembre quando è disponibile la produzione del nostro<br />
emisfero, mentre da ottobre a giugno le importazioni sono<br />
garantite dai diversi produttori dell’emisfero australe.<br />
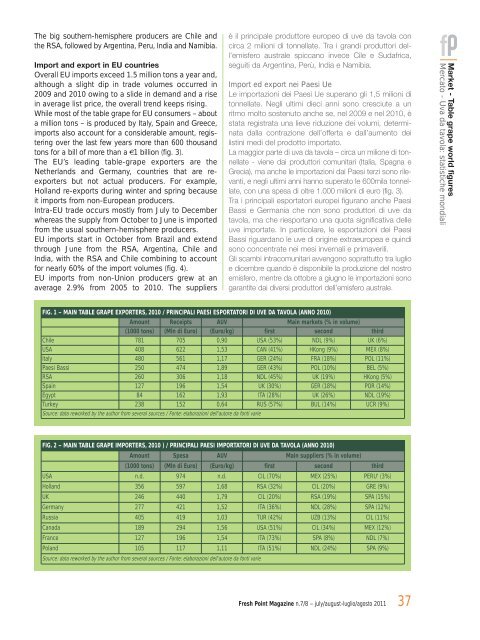
FIG. 1 – MAIN TABLE GRAPE EXPORTERS, 2010 / PRINCIPALI PAESI ESPORTATORI DI UVE DA TAVOLA (ANNO 2010)<br />
Amount Receipts AUV Main markets (% in volume)<br />
(1000 tons) (Mln di Euro) (Euro/kg) first second third<br />
Chile 781 705 0,90 USA (53%) NDL (9%) UK (6%)<br />
USA 408 622 1,53 CAN (41%) HKong (9%) MEX (8%)<br />
Italy 480 561 1,17 GER (<strong>24</strong>%) FRA (18%) POL (11%)<br />
Paesi Bassi 250 474 1,89 GER (43%) POL (10%) BEL (5%)<br />
RSA 260 306 1,18 NDL (45%) UK (19%) HKong (5%)<br />
Spain 127 196 1,54 UK (30%) GER (18%) POR (14%)<br />
Egypt 84 162 1,93 ITA (28%) UK (26%) NDL (19%)<br />
Turkey 238 152 0,64 RUS (57%) BUL (14%) UCR (9%)<br />
Source: data reworked by the author from several sources / Fonte: elaborazioni dell’autore da fonti varie<br />
FIG. 2 – MAIN TABLE GRAPE IMPORTERS, 2010 ) / PRINCIPALI PAESI IMPORTATORI DI UVE DA TAVOLA (ANNO 2010)<br />
Amount Spesa AUV Main suppliers (% in volume)<br />
(1000 tons) (Mln di Euro) (Euro/kg) first second third<br />
USA n.d. 974 n.d. CIL (70%) MEX (25%) PERU' (3%)<br />
Holland 356 597 1,68 RSA (32%) CIL (20%) GRE (9%)<br />
UK <strong>24</strong>6 440 1,79 CIL (20%) RSA (19%) SPA (15%)<br />
Germany 277 421 1,52 ITA (36%) NDL (28%) SPA (12%)<br />
Russia 405 419 1,03 TUR (42%) UZB (13%) CIL (11%)<br />
Canada 189 294 1,56 USA (51%) CIL (34%) MEX (12%)<br />
France 127 196 1,54 ITA (73%) SPA (8%) NDL (7%)<br />
Poland 105 117 1,11 ITA (51%) NDL (<strong>24</strong>%) SPA (9%)<br />
Source: data reworked by the author from several sources / Fonte: elaborazioni dell’autore da fonti varie<br />
<strong>Fresh</strong> <strong>Point</strong> <strong>Magazine</strong> n.7/8 – july/august-luglio/agosto 2011<br />
37<br />
Market - Table grape world figures<br />
Mercato - Uva da tavola: statistiche mondiali