Fresh Point Magazine - B2B24 - Il Sole 24 Ore
Fresh Point Magazine - B2B24 - Il Sole 24 Ore
Fresh Point Magazine - B2B24 - Il Sole 24 Ore

You also want an ePaper? Increase the reach of your titles
YUMPU automatically turns print PDFs into web optimized ePapers that Google loves.
Market - Table grape world figures<br />
Mercato - Uva da tavola: statistiche mondiali<br />
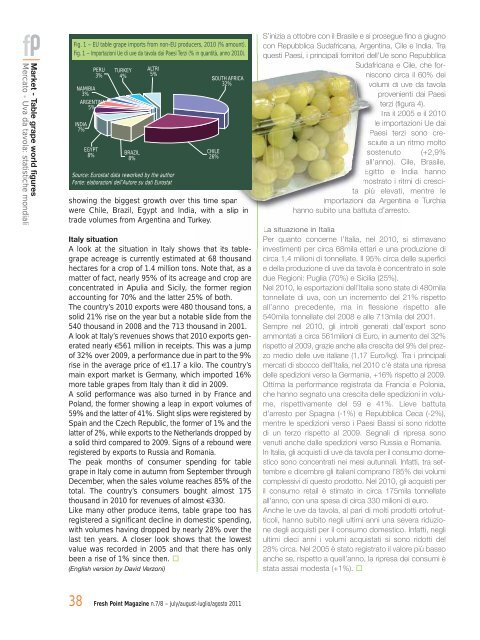
Fig. 1 – EU table grape imports from non-EU producers, 2010 (% amount).<br />
Fig. 1 – Importazioni Ue di uve da tavola dai Paesi Terzi (% in quantità, anno 2010).<br />
INDIA<br />
7%<br />
EGYPT<br />
8%<br />
PERU<br />
3%<br />
NAMIBIA<br />
3%<br />
ARGENTINA<br />
5%<br />
TURKEY<br />
4%<br />
BRAZIL<br />
8%<br />
ALTRI<br />
5%<br />
Source: Eurostat data reworked by the author<br />
Fonte: elaborazioni dell’Autore su dati Eurostat<br />
SOUTH AFRICA<br />
32%<br />
CHILE<br />
26%<br />
showing the biggest growth over this time span<br />
were Chile, Brazil, Egypt and India, with a slip in<br />
trade volumes from Argentina and Turkey.<br />
Italy situation<br />
A look at the situation in Italy shows that its tablegrape<br />
acreage is currently estimated at 68 thousand<br />
hectares for a crop of 1.4 million tons. Note that, as a<br />
matter of fact, nearly 95% of its acreage and crop are<br />
concentrated in Apulia and Sicily, the former region<br />
accounting for 70% and the latter 25% of both.<br />
The country’s 2010 exports were 480 thousand tons, a<br />
solid 21% rise on the year but a notable slide from the<br />
540 thousand in 2008 and the 713 thousand in 2001.<br />
A look at Italy’s revenues shows that 2010 exports generated<br />
nearly €561 million in receipts. This was a jump<br />
of 32% over 2009, a performance due in part to the 9%<br />
rise in the average price of €1.17 a kilo. The country’s<br />
main export market is Germany, which imported 16%<br />
more table grapes from Italy than it did in 2009.<br />
A solid performance was also turned in by France and<br />
Poland, the former showing a leap in export volumes of<br />
59% and the latter of 41%. Slight slips were registered by<br />
Spain and the Czech Republic, the former of 1% and the<br />
latter of 2%, while exports to the Netherlands dropped by<br />
a solid third compared to 2009. Signs of a rebound were<br />
registered by exports to Russia and Romania.<br />
The peak months of consumer spending for table<br />
grape in Italy come in autumn from September through<br />
December, when the sales volume reaches 85% of the<br />
total. The country’s consumers bought almost 175<br />
thousand in 2010 for revenues of almost €330.<br />
Like many other produce items, table grape too has<br />
registered a significant decline in domestic spending,<br />
with volumes having dropped by nearly 28% over the<br />
last ten years. A closer look shows that the lowest<br />
value was recorded in 2005 and that there has only<br />
been a rise of 1% since then.<br />
(English version by David Verzoni)<br />
38 <strong>Fresh</strong> <strong>Point</strong> <strong>Magazine</strong> n.7/8 – july/august-luglio/agosto 2011<br />
S’inizia a ottobre con il Brasile e si prosegue fino a giugno<br />
con Repubblica Sudafricana, Argentina, Cile e India. Tra<br />
questi Paesi, i principali fornitori dell’Ue sono Repubblica<br />
Sudafricana e Cile, che forniscono<br />
circa il 60% dei<br />
volumi di uve da tavola<br />
provenienti dai Paesi<br />
terzi (figura 4).<br />
Tra il 2005 e il 2010<br />
le importazioni Ue dai<br />
Paesi terzi sono cresciute<br />
a un ritmo molto<br />
sostenuto (+2,9%<br />
all’anno). Cile, Brasile,<br />
Egitto e India hanno<br />
mostrato i ritmi di crescita<br />
più elevati, mentre le<br />
importazioni da Argentina e Turchia<br />
hanno subito una battuta d’arresto.<br />
La situazione in Italia<br />
Per quanto concerne l’Italia, nel 2010, si stimavano<br />
investimenti per circa 68mila ettari e una produzione di<br />
circa 1,4 milioni di tonnellate. <strong>Il</strong> 95% circa delle superfici<br />
e della produzione di uve da tavola è concentrato in sole<br />
due Regioni: Puglia (70%) e Sicilia (25%).<br />
Nel 2010, le esportazioni dell’Italia sono state di 480mila<br />
tonnellate di uva, con un incremento del 21% rispetto<br />
all’anno precedente, ma in flessione rispetto alle<br />
540mila tonnellate del 2008 e alle 713mila del 2001.<br />
Sempre nel 2010, gli introiti generati dall’export sono<br />
ammontati a circa 561milioni di Euro, in aumento del 32%<br />
rispetto al 2009, grazie anche alla crescita del 9% del prezzo<br />
medio delle uve italiane (1,17 Euro/kg). Tra i principali<br />
mercati di sbocco dell’Italia, nel 2010 c’è stata una ripresa<br />
delle spedizioni verso la Germania, +16% rispetto al 2009.<br />
Ottima la performance registrata da Francia e Polonia,<br />
che hanno segnato una crescita delle spedizioni in volume,<br />
rispettivamente del 59 e 41%. Lieve battuta<br />
d’arresto per Spagna (-1%) e Repubblica Ceca (-2%),<br />
mentre le spedizioni verso i Paesi Bassi si sono ridotte<br />
di un terzo rispetto al 2009. Segnali di ripresa sono<br />
venuti anche dalle spedizioni verso Russia e Romania.<br />
In Italia, gli acquisti di uve da tavola per il consumo domestico<br />
sono concentrati nei mesi autunnali. Infatti, tra settembre<br />
e dicembre gli italiani comprano l’85% dei volumi<br />
complessivi di questo prodotto. Nel 2010, gli acquisti per<br />
il consumo retail è stimato in circa 175mila tonnellate<br />
all’anno, con una spesa di circa 330 milioni di euro.<br />
Anche le uve da tavola, al pari di molti prodotti ortofrutticoli,<br />
hanno subito negli ultimi anni una severa riduzione<br />
degli acquisti per il consumo domestico. Infatti, negli<br />
ultimi dieci anni i volumi acquistati si sono ridotti del<br />
28% circa. Nel 2005 è stato registrato il valore più basso<br />
anche se, rispetto a quell’anno, la ripresa dei consumi è<br />
stata assai modesta (+1%).