NORSK ENTOMOLOGISK TIDSSKRIFT - Norsk entomologisk forening
NORSK ENTOMOLOGISK TIDSSKRIFT - Norsk entomologisk forening
NORSK ENTOMOLOGISK TIDSSKRIFT - Norsk entomologisk forening

You also want an ePaper? Increase the reach of your titles
YUMPU automatically turns print PDFs into web optimized ePapers that Google loves.
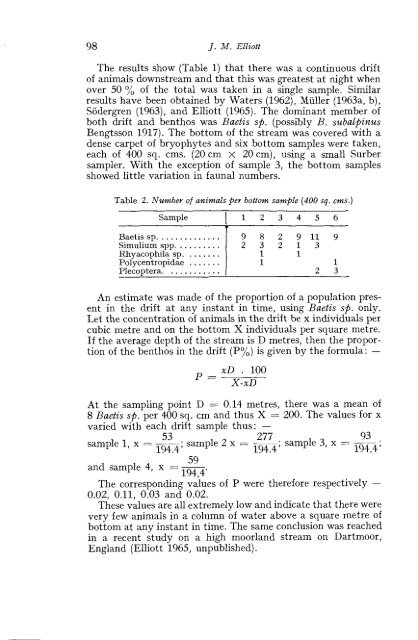
98 J. M. Elliott<br />
The results show (Table 1) that there was a continuous drift<br />
of animals downstream and that this was greatest at night when<br />
over 50 % of the total was taken in a single sample. Similar<br />
results have been obtained by Waters (1962), Miiller (1963a, b),<br />
Sodergren (1963), and Elliott (1965). The dominant member of<br />
both drift and benthos was Baetis sp. (possibly B. subalpinus<br />
Bengtsson 1917). The bottom of the stream was covered with a<br />
dense carpet of bryophytes and six bottom samples were taken,<br />
each of 400 sq. cms. (20 cm x 20 cm), using a small Surber<br />
sampler. With the exception of sample 3, the bottom samples<br />
showed little variation in faunal numbers.<br />
Table 2. ATumber of animals per bottom sample (400 sq. cms.)<br />
Sample 1 1 2 3 4 5 6<br />
Baetis sp. .............<br />
Simulium spp. .........<br />
Rhyacophila sp. .......<br />
Polycentropidae .......<br />
Plecoptera.<br />
...........<br />
9 8 2 9 11 9<br />
2 3 2 1 3<br />
1 1<br />
1 1<br />
2 3<br />
An estimate was made of the proportion of a population present<br />
in the drift at any instant in time, using Baetis s$. only.<br />
Let the concentration of animals in the drift be x individuals per<br />
cubic metre and on the bottom X individuals per square metre.<br />
If the average depth of the stream is D metres, then the proportion<br />
of the benthos in the drift (P%) is given by the formula: -<br />
At the sampling point D = 0.14 metres, there was a mean of<br />
8 Baetis sfi. per 400 sq. cm and thus X = 200. The values for x<br />
varied with Aeach driflt sample thus: -<br />
53 277 93<br />
sample 1, x = --; sample 2 x = --; sample 3, x = --.<br />
194.4 194.4 194,4 '<br />
59<br />
and sample 4, x =: -<br />
194,4'<br />
The corresponding values of P were therefore respectively -<br />
0.02, 0.11, 0.03 and 0.02.<br />
These values are all extremely low and indicate that there were<br />
very few animals in a column of water above a square metre of<br />
bottom at any instant in time. The same conclusion was reached<br />
in a recent study on a high moorland stream on Dartmoor,<br />
England (Elliott 1965, unpublished).