- Page 1 and 2:
NORGES OFFISIELLE STATISTIKK XII 24
- Page 3 and 4:
Forord Ordningen av tabellene i Sta
- Page 5 and 6:
Preface The tables in the Statistic
- Page 7 and 8:
*9 Innhold. Contents. Kapitler: Cha
- Page 9 and 10:
*11 Tabell Side 33. Kremasjoner 195
- Page 11 and 12:
*13 Tabell Side Table Page 81. Det
- Page 13 and 14:
*15 Tabell Side 133. Volum- og pris
- Page 15 and 16:
*17 Tabell Side 190. Aksjeselskapen
- Page 17 and 18:
*19 Tabell Side XVI. Priser, leveko
- Page 19 and 20:
* 21 Tabell Side 290. Drukkenskapsf
- Page 21 and 22:
* 23 Tabell Side 341. Oversikt over
- Page 23 and 24:
* 25 Side Administrative delinger 2
- Page 25 and 26:
* 27 Side Folketall, Norge 5-24 int
- Page 27 and 28:
* 29 Side Kommunal- og sosialskole.
- Page 29 and 30:
*31 Side Rull. materiell, jernb. 14
- Page 31 and 32:
*33 Alphabetical index: Page Academ
- Page 33 and 34:
*35 Page Grains, area 47, 378, 379
- Page 35:
*37 Page Technolog. Institute 240 T
- Page 38 and 39:
Rikets inndelinger. 2 Administrativ
- Page 40 and 41: Meteorologiske forhold. 4 Climate.
- Page 42 and 43: Befolkning. Population. 6 Tabell 5.
- Page 44 and 45: Befolkning. 8 Population. Tabell 7
- Page 46 and 47: Befolkning. 10 Population. Tabell 7
- Page 48 and 49: Befolkning 12 Population. Tabell 8.
- Page 50 and 51: • Befolkning. 14 Population Tabel
- Page 52: Tabell 11. Bestående ekteskap ford
- Page 55 and 56: Befolkning. 18 Population. Tabell 1
- Page 57: Tabell 17. Personer 15 år og mer e
- Page 60 and 61: Befolkning. 22 Population. Tabell 1
- Page 62 and 63: Befolkning. Population. 24 Tabell 1
- Page 64 and 65: Folkemengdens bevegelse. 26 Vital s
- Page 66 and 67: Folkemengden bevegelse. 28 Vital st
- Page 68 and 69: Folkemengden bevegelse. 30 Vital st
- Page 70 and 71: Folkemengdens bevegelse. 32 Vital s
- Page 73 and 74: Folkemengdens bevegelse. 34 Vital s
- Page 75 and 76: Folkemengdens bevegelse. 36 Vital s
- Page 77 and 78: Sunnhetstilstand, dødsårsaker. 38
- Page 79 and 80: Sunnhetstilstand, dødsårsaker. 40
- Page 81 and 82: Sunnhetstilstand, dødsårsaker. 42
- Page 83 and 84: Sunnhetstilstand, dødsårsaker. 44
- Page 85 and 86: Sunnhetstilstand, dødsårsaker. 46
- Page 87 and 88: Jordbruk. 48 Agriculture. Tabell 56
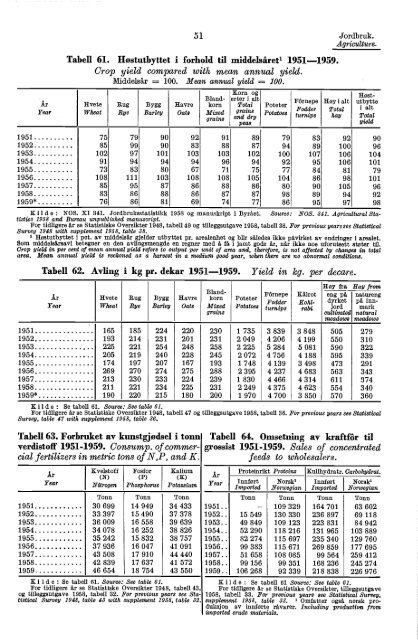
- Page 89: Jordbruk. 50 Agriculture. Tabell 60
- Page 93 and 94: Jordbruk. 54 Agriculture. Tabell 67
- Page 95 and 96: Jordbruk. 56 Agriculture. Tabell 70
- Page 98 and 99: Jordbruk. Agriculture. 58 Tabell 72
- Page 101 and 102: Jordbruk. Agriculture. 60 Tabell 75
- Page 103: Tabell 78. Skogarealet etter fylker
- Page 106 and 107: Skogbruk. 64 Forestry. Tabell 80. S
- Page 108 and 109: il Skogbruk. 66 Forestry. Tabell 83
- Page 110 and 111: Skogbruk. Forestry. 68 Tabell 85 (f
- Page 112 and 113: Skogbruk. Forestry. 70 Tabell 89. S
- Page 114 and 115: Fiske, sel- og hvalfangst. 72 Fishe
- Page 116 and 117: Fiske, sel- og hvalfangst. 74 Fishe
- Page 118 and 119: Fiske, sel- og hvalfangst. 76 Fishe
- Page 120 and 121: Fiske, sel- og hvalfangst. 78 Fishe
- Page 122 and 123: Fiske, sel- og hvalfangst. 80 Fishe
- Page 124 and 125: Bedriftstelling. Census of establis
- Page 126 and 127: Bedriftstelling. 84 Census of estab
- Page 128 and 129: Bedriftstelling. Census of establis
- Page 130 and 131: Bergverk og industri. 88 Mining and
- Page 132 and 133: Bergverk og industri. 90 Mining and
- Page 134 and 135: Bergverk og industri. 92 Mining and
- Page 136 and 137: Bergverk og industri. 94 Mining and
- Page 138 and 139: Bergverk og industri. 96 Mining and
- Page 140 and 141:
Bergverk og industri. 98 Mining and
- Page 142:
Tabell 126. Elektriske anlegg og in
- Page 145 and 146:
Bergverk og industri. 102 Mining an
- Page 147 and 148:
Varehandel. 104 Trade. Tabell 132.
- Page 149 and 150:
Varehandel. 106 Trade. Tabell 134.
- Page 151 and 152:
Varehandel. 108 Trade. Tabell 134 (
- Page 153 and 154:
Varehandel. 110 Trade. Tabell 134 (
- Page 155 and 156:
Varehandel. 112 Trade. Tabell 134 (
- Page 157 and 158:
Varehandel. 114 Trade. Tabell 134 (
- Page 159 and 160:
Varehandel. 116 Trade. Tabell 135.
- Page 161 and 162:
Varehandel. 118 Trade. Tabell 135 (
- Page 163 and 164:
Varehandel. 120 Trade. Tabell 136.
- Page 165 and 166:
Varehandel. 122 Trade. Tabell 136 (
- Page 167 and 168:
Varehandel. 124 Trade. Tabell 138.
- Page 169:
Ar og fylker Year. Counties Tabell
- Page 172 and 173:
Sjøtransport. 128 Water transport.
- Page 174 and 175:
Sjøtransport. 130 Water transport.
- Page 176 and 177:
Sjøtransport. Water transport. 132
- Page 178 and 179:
Sjøtransport. Water transport. Tab
- Page 180 and 181:
Sjøtransport. Water transport. 136
- Page 182 and 183:
Sjøtransport. 138 Water transport.
- Page 184 and 185:
Samferdsel. 140 Transport and commu
- Page 186 and 187:
Samferdsel. 142 Transport and commu
- Page 188 and 189:
Samferdsel. 144 Transport and commu
- Page 190 and 191:
Samferdsel. 146 Transport and commu
- Page 192 and 193:
Samferdsel. 148 Transport and commu
- Page 194 and 195:
Samferdsel. 150 Transport and commu
- Page 196 and 197:
Samferdsel. 152 Transport and commu
- Page 198 and 199:
Penge- og kredittmarked. Money and
- Page 200 and 201:
Penge- og kredittmarked. 156 Money
- Page 202 and 203:
Penge- og kredittmarked. 158 Money
- Page 204 and 205:
Penge- og kredittmarked. 160 Money
- Page 206 and 207:
Penge- og kredittmarked. 162 Money
- Page 208 and 209:
Penge- og kredittmarked. 164 Money
- Page 210:
^=^^X ^^^. S^=^6am^^r *.^ 0^^r f^o^
- Page 213 and 214:
Penge- og kredittmarked. 168 Money
- Page 215 and 216:
Penge- og kredittmarked. 170 Money
- Page 217 and 218:
Penge- og kredittmarked. 172 Money
- Page 219 and 220:
Penge- og kredittmarked. Money and
- Page 221 and 222:
Privatforsikring. 176 Private insur
- Page 223 and 224:
Privatforsikring. 178 Private insur
- Page 225 and 226:
Privatforsikring. 180 Private insur
- Page 227 and 228:
Sosial trygd og forsorg. 182 Social
- Page 229 and 230:
Sosial trygd og forsorg. 184 Social
- Page 231 and 232:
Sosial trygd og forsorg. 186 Social
- Page 233 and 234:
Sosial trygd og forsorg. 188 Social
- Page 235 and 236:
Sosial trygd og forsorg. 190 Social
- Page 237 and 238:
Priser, levekostnader m. v. 192 Pri
- Page 239 and 240:
Priser, levekostnader m. v. 194 Pri
- Page 241 and 242:
Priser, levekostnader m. v. 196 Pri
- Page 243 and 244:
Priser, levekostnader m. v. 198 Pri
- Page 245 and 246:
Priser, levekostnader m. v. 200 Pri
- Page 247 and 248:
Arbeidsmarked, lønninger m. v. 202
- Page 249 and 250:
Arbeidsmarked, lønninger m. v. 204
- Page 251 and 252:
Arbeidsmarked, lønninger m. v. 206
- Page 253 and 254:
Arbeidsmarked, lønninger m. v. Lab
- Page 255 and 256:
Arbeidsmarked, lønninger m. v. 210
- Page 257 and 258:
Arbeidsmarked, lønninger m. v. 212
- Page 259 and 260:
Arbeidsmarked, lønninger m. v. 214
- Page 261 and 262:
Arbeidsmarked, lønninger m. v. 216
- Page 263 and 264:
Arbeidsmarked, lønninger m. v. 218
- Page 265 and 266:
Arbeidsmarked, lønninger m. v. 220
- Page 267 and 268:
Arbeidsmarked, lønninger m. v. 222
- Page 269 and 270:
Arbeidsmarked, lønninger m. v. 224
- Page 271 and 272:
Alkoholforbruk m. v. 226 Alcoholic
- Page 273 and 274:
Alkoholforbruk m. v. Rettsvesen. 22
- Page 275 and 276:
Rettsvesen. 230 Justice and crime.
- Page 277 and 278:
Rettsvesen. Justice and crime. 232
- Page 279 and 280:
Rettsvesen. Justice and crime. 234
- Page 281 and 282:
Rettsvesen. 236 Justice and crime.
- Page 283 and 284:
Undervisning. 238 Education. Tabell
- Page 285 and 286:
Undervisning. 240 Education. Tabell
- Page 287 and 288:
Undervisning m. v. 242 Education et
- Page 289 and 290:
Undervisning. 244 Etiop. Tabell 319
- Page 291 and 292:
Undervisning. 246 Education. Tabell
- Page 293 and 294:
Undervisning m. v. 248 Education et
- Page 295 and 296:
Undervisning m. v. 250 Education et
- Page 297 and 298:
Undervisning m. v. 252 Education et
- Page 299 and 300:
Undervisning m. v. 254 Education et
- Page 301 and 302:
Undervisning m. v. 256 Education et
- Page 303 and 304:
Finanser. 25 8 Puplic finance. Tabe
- Page 305 and 306:
Finanser. 260 Public finance. Tabel
- Page 307 and 308:
Finanser. 262 Public finance. Tabel
- Page 309 and 310:
Finanser. 264 Public finance. Tabel
- Page 311 and 312:
Finanser. 266 Public finance. Tabel
- Page 313 and 314:
Finanser. 268 Public finance. Tabel
- Page 315 and 316:
Finanser. 270 Public finance. Tabel
- Page 317 and 318:
Finanser. 272 Public finance. Eiend
- Page 319 and 320:
Finanser. 274 Public finance. Tabel
- Page 321:
Tabell 347. Nasjonaløkonomisk grup
- Page 325 and 326:
Finanser. 278 Public finance. Taken
- Page 327 and 328:
Finanser. 280 Public finance. Tabel
- Page 329 and 330:
Nasjonalregnskap. 282 National acco
- Page 331 and 332:
Nasjonalregnskap. 284 National acco
- Page 333 and 334:
Nasjonalregnskap. 286 National acco
- Page 335 and 336:
Nasjonalregnskap. 288 National acco
- Page 337:
Tabell 361. Stortingsvalgene 1945,
- Page 341 and 342:
Valg. Elections. 292 Tabell 363. Ko
- Page 343:
Tabell 364. Kommunevalgene 1947, 19
- Page 346 and 347:
Må1 og vekt. 296 Measures and weig
- Page 348 and 349:
Internasjonale oversikter. 298 Tabe
- Page 350 and 351:
Internasjonale oversikter. 300 Tabe
- Page 352 and 353:
Internasjonale oversikter. 302 Tabe
- Page 354 and 355:
Internasjonale oversikter. 304 Tabe
- Page 356 and 357:
Internasjonale oversikter. 306 Tabe
- Page 358 and 359:
Internasjonale oversikter. 308 Tabe
- Page 360 and 361:
Internasjonale oversikter. 310 Tabe
- Page 362 and 363:
Internasjonale oversikter. 312 Tabe
- Page 364 and 365:
Internasjonale oversikter. 314 Tabe
- Page 366 and 367:
Internasjonale oversikter. 316 Tabe
- Page 368:
Norge Danmark Land År Kjønn Døde
- Page 372:
Tabell 373 (forts.). Døde pr. 1000
- Page 375 and 376:
Internasjonale oversikter. 322 Tabe
- Page 377 and 378:
Internasjonale oversikter. 324 Tabe
- Page 379 and 380:
Internasjonale oversikter. 326 Tabe
- Page 381 and 382:
Internasjonale oversikter. 328 Tabe
- Page 383 and 384:
Internasjonale oversikter. 330 Tabe
- Page 385 and 386:
Internasjonale oversikter. 332 Tabe
- Page 387 and 388:
Internasjonale oversikter. 334 Tabe
- Page 389 and 390:
Internasjonale oversikter. 336 Tabe
- Page 391 and 392:
Internasjonale oversikter. 338 Tabe
- Page 393 and 394:
Internasjonale oversikter. 340 Tabe
- Page 395 and 396:
Internasjonale oversikter. 342 Tabe
- Page 397 and 398:
Internasjonale oversikter. 344 Tabe
- Page 399 and 400:
Internasjonale oversikter. 346 Tabe
- Page 401 and 402:
Internasjonale oversikter. 348 Tabe
- Page 403 and 404:
Internasjonale oversikter. 350 Land
- Page 405 and 406:
Internasjonale oversikter. 352 Tabe
- Page 407 and 408:
Internasjonale oversikter. 354 Tabe
- Page 409 and 410:
Internasjonale oversikter. 356 Tabe
- Page 411 and 412:
Internasjonale oversikter. 358 Tabe
- Page 413 and 414:
Internasjonale oversikter. 360 Tabe
- Page 415 and 416:
Internasjonale oversikter. 362' Tab
- Page 417 and 418:
Internasjonale oversikter. 364 År
- Page 419 and 420:
Internasjonale oversikter. 366 Tabe
- Page 421 and 422:
Internasjonale oversikter. 368 Tabe
- Page 423 and 424:
Internasjonale oversikter. 370 Tabe
- Page 425 and 426:
Internasjonale oversikter. 372 Land
- Page 427 and 428:
Internasjonale oversikter. 374 Tabe
- Page 430 and 431:
377 Tilleggstabeller - Jordbruk. Ad
- Page 432 and 433:
Jordbrukstellingen 20. juni 1959. D
- Page 434 and 435:
Jordbrukstellingen 20. juni 1959. C
- Page 436 and 437:
Jordbrukstellingen 20. juni 1959. C
- Page 438:
Rettinger i Statistisk årbok 1960