


Create successful ePaper yourself
Turn your PDF publications into a flip-book with our unique Google optimized e-Paper software.
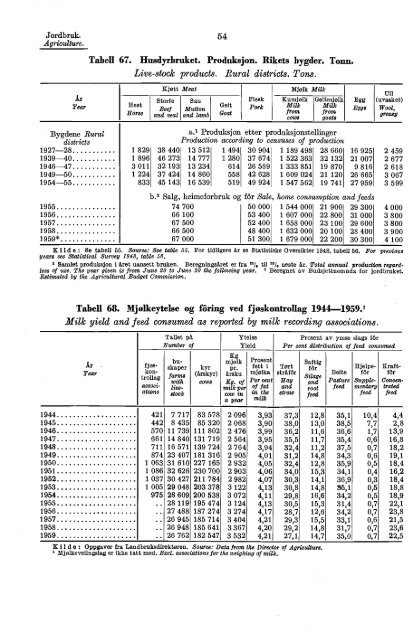
Jordbruk. 54<br />
Agriculture.<br />
Tabell 67. Husdyrbruket. Produksjon. Rikets bygder. Tonn.<br />
Live-stock products. Rural districts. Tons.<br />
Kjøtt Meat<br />
Mjølk Milk<br />
1311<br />
År Storfe Sau Flesk Kumjølk Geitmjølk Egg (uvasket)<br />
Year<br />
Hest<br />
Geit<br />
Beef Mutton<br />
Pork Milk Milk Eggs Wool,<br />
Horse and veal and lamb Goat<br />
from from<br />
cows goats<br />
grimy<br />
Bygdene Rural<br />
a. 1 Produksjon etter produksjonstellinger<br />
districts<br />
Production according to censuses of production<br />
1927-28 1 829 38 440 13 512 1 494 30 904 1 189 498 28 660 16 925 2 459<br />
1939-40 1 896 46 273 14 777 1 280 37 674 1 522 363 32 132 21 007 2 677<br />
1946-47 3 011 32 193 13 234 614 26 589 1 333 851 19 870 9 816 2 618<br />
1949-50 1 224 37 424 14 860 558 42 628 1 609 024 21 120 26 665 3 067<br />
1954-55 833 45 143 16 539 519 49 924 1 547 562 19 741 27 959 3 599<br />
b. 2 Salg, heimeforbruk og for Sale, home consumption and feeds<br />
1955 74 700 50 000 1 544 000 21 900 29 300 4 000<br />
1956 66 100 53 400 1 607 000 22 800 31 000 3 800<br />
1957 67 500 52 400 1 658 000 23 100 29 600 3 800<br />
1958 66 500 48 400 1 632 000 20 100 28 400 3 900<br />
1959* 67 000 51 300 1 679 000 22 200 30 300 4 100<br />
Kilda: Se tabell 55. Source: See table 55. For tidligere år se Statist'ske Oversikter 1948, tabell 56. For previous<br />
years see Statistical Survey 1948, table 56.<br />
Samlet produksjon i året uansett bruken. Beregningsåret er fra 50/. til °h, neste år. Total annual production regardless<br />
of use. The year given is from June 20 to June 20 the following year. ° Beregnet av Budsjettnemnda for jordbruket.<br />
Estimated by the Agricultural Budget Commission.<br />
Tabell 68. Mjoikeytelse og foring ved fjoskontrollag 1944-1959)<br />
Milk yield and feed consumed as reported by milk recording associations.<br />
Tallet på<br />
Number of<br />
Ytelse<br />
Yield<br />
Prosent av ymse slags for<br />
Per cent distribution of feed consumed<br />
Kg<br />
bu-<br />
mjr.k Prosent Saftig<br />
Ar<br />
fjøs<br />
skaper kyr fett i Tørt<br />
Hjelpe- Kraft-<br />
Year konfam<br />
(årskyr) årsku Øolka stråfor silage Beite for for<br />
trollag<br />
cows Kg. of Per cent Hay Pasture Supple- Concenassoei-<br />
live- milk per of fat and root feed mentary trated<br />
ations stock cow in n the straw feed feed fee<br />
a milk<br />
1944 421 7 717 83 578 2 096 3,93 37,3 12,8 35,1 10,4 4,4<br />
1945 442 8 435 85 320 2 068 3,90 38,0 13,0 38,5 7,7 2,8<br />
1946 570 11 739 111 802 2 476 3,99 36,2 11,6 36,6 1,7 13,9<br />
1947 661 14 840 131 719 2 564 3,95 35,5 11,7 35,4 0,6 16,8<br />
1948 711 16 571 139 724 2 764 3,94 32,4 11,2 37,5 0,7 18,2<br />
1949 874 23 407 181 316 2 905 4,01 31,2 14,8 34,3 0,6 19,1<br />
1950 1 063 31 610 227 165 2 932 4,05 32,4 12,8 35,9 0,5 18,9<br />
1951 1 086 32 626 230 700 2 903 4,06 34,0 15,3 34,1 0,4 16,2<br />
1952 1 037 30 427 211 784 2 982 4,07 30,3 14,1 36,9 0,3 18,9<br />
1953 1 005 29 048 203 378 3 122 4,13 30,8 14,8 95,1 0,5 18,8<br />
1954 975 28 609 200 538 3 072 4,11 29,8 16,6 34,2 0,5 18,9<br />
1955 .. 28 119 195 474 3 124 4,13 30,5 15,3 31,4 0,7 22,1<br />
1956 .. 27 488 187 274 3 274 4,17 28,7 12,6 34,2 0,7 23,8<br />
1957 .. 26 945 185 714 3 404 4,21 29,3 15,5 33,1 0,6 21,5<br />
1958 .. 26 948 185 641 3 367 4,20 29,2 14,8 31,7 0,7 23,6<br />
1959 .. 26 762 182 547 3 532 4,21 27,1 14,7 35,0 0,7 22,5<br />
K i Ide : Oppgaver fra Landbruksdirektøren. Source: Data from the Director of Agriculture.<br />
Mjølkeveiingslag er ikke tatt med. Excl. associations for the weighing of milk.


