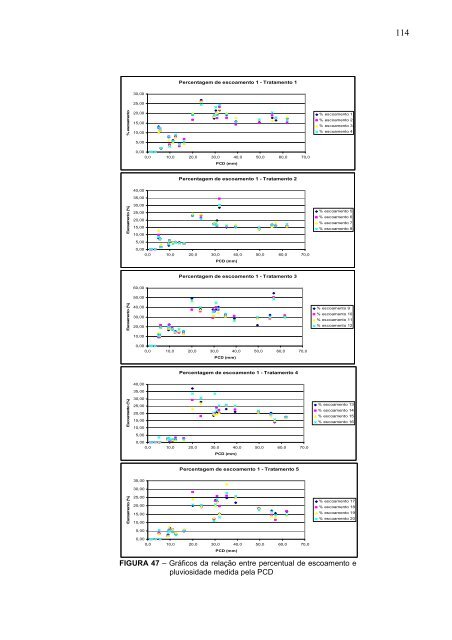
% escoamento Escoamento (%) Escoamento (%) Escoamento (%) Escoamento (%) 30,00 25,00 20,00 15,00 10,00 5,00 Percentagem <strong>de</strong> escoamento 1 - Tratamento 1 0,00 0,0 10,0 20,0 30,0 40,0 50,0 60,0 70,0 40,00 35,00 30,00 25,00 20,00 15,00 10,00 5,00 PCD (mm) Percentagem <strong>de</strong> escoamento 1 - Tratamento 2 0,00 0,0 10,0 20,0 30,0 40,0 50,0 60,0 70,0 60,00 50,00 40,00 30,00 20,00 10,00 PCD (mm) Percentagem <strong>de</strong> escoamento 1 - Tratamento 3 0,00 0,0 10,0 20,0 30,0 40,0 50,0 60,0 70,0 40,00 35,00 30,00 25,00 20,00 15,00 10,00 5,00 PCD (mm) Percentagem <strong>de</strong> escoamento 1 - Tratamento 4 0,00 0,0 10,0 20,0 30,0 40,0 50,0 60,0 70,0 35,00 30,00 25,00 20,00 15,00 10,00 5,00 PCD (mm) Percentagem <strong>de</strong> escoamento 1 - Tratamento 5 0,00 0,0 10,0 20,0 30,0 40,0 50,0 60,0 70,0 PCD (mm) % escoamento 1 % escoamento 2 % escoamento 3 % escoamento 4 % escoamento 5 % escoamento 6 % escoamento 7 % escoamento 8 % escoamento 9 % escoamento 10 % escoamento 11 % escoamento 12 % escoamento 13 % escoamento 14 % escoamento 15 % escoamento 16 % escoamento 17 % escoamento 18 % escoamento 19 % escoamento 20 FIGURA 47 – Gráficos da relação entre percentual <strong>de</strong> escoamento e pluviosida<strong>de</strong> medida pela PCD 114
TABELA 04 – Regressão entre dados <strong>de</strong> pluviômetros e lâminas <strong>de</strong> água infiltrada Tratamento Função R² ajustado Tratamento 1 y = 0,599 + 0,8087 x 0,9954 Tratamento 2 y = 0,500 + 0,8197 x 0,9931 Tratamento 3 y = 1,480 + 0,6173 x 0,9495 Tratamento 4 y = 0,650 + 0,7908 x 0,9899 Tratamento 5 y = 0,510 + 0,8131 x 0,9901 FIGURA 48 – Gráfico da relação entre pluviometria e lâmina <strong>de</strong> água infiltrada – Tratamento 1 FIGURA 49 – Gráfico da relação entre pluviometria e lâmina <strong>de</strong> água infiltrada – Tratamento 2 115
- Page 1 and 2:
UNIVERSIDADE FEDERAL DO PARANÁ - U
- Page 3 and 4:
À Mazé, minha razão maior nesta
- Page 5 and 6:
SUMÁRIO LISTA DE FIGURAS .........
- Page 7 and 8:
LISTA DE FIGURAS FIGURA 01 - Esquem
- Page 9 and 10:
FIGURA 51 - Gráfico da pluviometri
- Page 11 and 12:
LISTA DE QUADROS QUADRO 01 - Dados
- Page 13 and 14:
RESUMO Este trabalho teve por objet
- Page 15 and 16:
1 INTRODUÇÃO Quando existia apare
- Page 17 and 18:
preservação ambiental. A necessid
- Page 19 and 20:
No entanto, a sociedade continua a
- Page 21 and 22:
Portanto, os mananciais necessitam
- Page 23 and 24:
O método a ser selecionado para de
- Page 25 and 26:
No caso de escoamento permanente, c
- Page 27 and 28:
Mesmo um equipamento reconhecidamen
- Page 29 and 30:
2 REVISÃO BIBLIOGRÁFICA A água
- Page 31 and 32:
Dentro desse conhecimento, é impor
- Page 33 and 34:
a evaporação de água do solo. To
- Page 35 and 36:
FIGURA 02 - Esquema representativo
- Page 37 and 38:
- granizo é a precipitação ocorr
- Page 39 and 40:
Embora a mensuração das precipita
- Page 41 and 42:
pesquisador deverá escolher aquele
- Page 43 and 44:
Sua determinação exige uma metodo
- Page 45 and 46:
transferência de água do nível f
- Page 47 and 48:
de argila, esse fenômeno não é t
- Page 49 and 50:
de água no solo, ela deve ser obti
- Page 51 and 52:
mantendo o fluxo na direção verti
- Page 53 and 54:
Na utilização dos infiltrômetros
- Page 55 and 56:
- o uso do infiltrômetro de anéis
- Page 57 and 58:
de sedimentos nas estradas, carread
- Page 59 and 60:
80 cm de altura e 1 mm de espessura
- Page 61 and 62:
O escoamento superficial pode tamb
- Page 63 and 64:
têm significância para a sociedad
- Page 65 and 66:
escoamento sub-superficial (Ri) - r
- Page 67 and 68:
Trabalhando com plantação de seri
- Page 69 and 70:
FIGURA 10 - Esquema da Interceptaç
- Page 71 and 72:
FIGURA 11 - Esquema dos componentes
- Page 73 and 74:
Medição de Et - colocação de ca
- Page 75 and 76:
confeccionado em garrafa PET, dista
- Page 77 and 78: Comparando os resultados encontrado
- Page 79 and 80: total de 1.285 mm. A interceptaçã
- Page 81 and 82: A topografia é bastante variável,
- Page 83 and 84: 3.2 Experimento 01 - Infiltração
- Page 85 and 86: Com a técnica construtiva adotada,
- Page 87 and 88: eflorestamento, onde nem sempre é
- Page 89 and 90: fundo do tambor, prevenindo que pud
- Page 91 and 92: muito importante para permitir se d
- Page 93 and 94: 3.2.2 Procedimentos de Instalação
- Page 95 and 96: podiam ser facilmente feitos no pr
- Page 97 and 98: FIGURA 26 - Foto do travamento do t
- Page 99 and 100: 3.2.3 Procedimentos de coleta de da
- Page 101 and 102: Verificava-se também a correção
- Page 103 and 104: Como o infiltrômetro de duplo poss
- Page 105 and 106: d) Equipamentos e materiais para le
- Page 107 and 108: FIGURA 33 - Foto da colocação do
- Page 109 and 110: muito seco provocaria elevado consu
- Page 111 and 112: A interceptação parcial (IP), no
- Page 113 and 114: Embora não se esteja aqui apresent
- Page 115 and 116: B.2 TRATAMENTO 2 Média Média Águ
- Page 117 and 118: B.4 TRATAMENTO 4 Média Média Águ
- Page 119 and 120: C.1 - Pluviosidade (PCD e pluviôme
- Page 121 and 122: FIGURA 38 - Gráfico da relação e
- Page 123 and 124: significativa, a realidade das prec
- Page 125 and 126: Escoamento (ml) 3000,0 2500,0 2000,
- Page 127: Evidencia-se que no Tratamento 3, c
- Page 131 and 132: Para permitir uma melhor visualiza
- Page 133 and 134: mm FIGURA 53 - Gráfico da infiltra
- Page 135 and 136: FIGURA 57 - Gráfico da infiltraç
- Page 137 and 138: FIGURA 59 - Gráfico das curvas de
- Page 139 and 140: F - ANÁLISE DA INTERCEPTAÇÃO DA
- Page 141 and 142: FIGURA 65 - Gráfico da correlaçã
- Page 143 and 144: orografia propiciada pelo relevo da
- Page 145 and 146: dossel florestal, nos pontos onde e
- Page 147 and 148: Evidencia-se também, pela observa
- Page 149 and 150: Anéis concênt. mm/h Infiltrômetr
- Page 151 and 152: na prática, para as condições em
- Page 153 and 154: mm/h mm/h 140 ,0 135 ,0 130 ,0 125
- Page 155 and 156: mm/h 95,0 90,0 85,0 80,0 75,0 70,0
- Page 157 and 158: Determinação 1 - Pinus, relevo on
- Page 159 and 160: c) infiltração de água no solo:
- Page 161 and 162: descritos no item de “Revisão Bi
- Page 163 and 164: tais como reservas legais, áreas d
- Page 165 and 166: Sensoriamento Remoto, Goiânia, Bra
- Page 167 and 168: CHOW, V. T.; MAIDMENT, D. R.; MAYS,
- Page 169 and 170: Recursos Hídricos e Simpósio Inte
- Page 171 and 172: OLIVEIRA, G. C. Gestão de Recursos
- Page 173 and 174: SAMPAIO, S. C.; CORRÊA, M. M.; VIL
- Page 175 and 176: TUCCI, C. E. M. Impactos da variabi
- Page 177 and 178: ANEXO I - ANEXOS DO EXPERIMENTO 1 A
- Page 179 and 180:
ANEXO I.2 - CURVAS DE TENDÊNCIA PA
- Page 181 and 182:
FIGURA 78 - Gráfico das Curvas de
- Page 183 and 184:
FIGURA 82 - Foto do detalhe da lâm
- Page 185 and 186:
FIGURA 86 - Foto da borda da Flores
- Page 187 and 188:
ANEXO II - ANEXOS DO EXPERIMENTO 2
- Page 189 and 190:
2) Determinação 1 Medição 1 Ret
- Page 191 and 192:
4) Determinação 1 Medição 2 Ret
- Page 193 and 194:
6) Determinação 2 Medição 1 Cil
- Page 195 and 196:
8) Determinação 2 Medição 1 Ret
- Page 197 and 198:
10) Determinação 2 Medição 2 Re
- Page 199 and 200:
12) Determinação 3 Medição 1 Re
- Page 201:
14) Determinação 3 Medição 2 Re