Årsrapport 2011 - Region Sjælland
Årsrapport 2011 - Region Sjælland
Årsrapport 2011 - Region Sjælland

You also want an ePaper? Increase the reach of your titles
YUMPU automatically turns print PDFs into web optimized ePapers that Google loves.
F A C U L T Y O F H E A L T H S C I E N C E S<br />
U N I V E R S I T Y O F C O P E N H A G E N<br />
P 67<br />
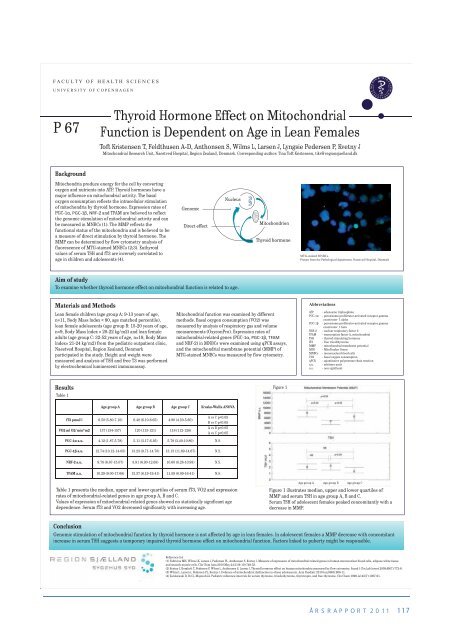
Background<br />
Materials and Methods<br />
Toft Kristensen T, Feldthusen A-D, Anthonsen S, Wilms L, Larsen J, Lyngsie Pedersen P, Kvetny J<br />
Mitochondrial Research Unit, Naestved Hospital, <strong>Region</strong> Zealand, Denmark. Corresponding author: Tina Toft Kristensen, tikr@regionsjaelland.dk<br />
Mitochondria produce energy for the cell by converting<br />
oxygen and nutrients into ATP. Thyroid hormones have a<br />
major influence on mitochondrial activity. The basal<br />
oxygen consumption reflects the intracellular stimulation<br />
of mitochondria by thyroid hormone. Expression rates of<br />
PGC-1α, PGC-1β, NRF-2 and TFAM are believed to reflect<br />
the genomic stimulation of mitochondrial activity and can<br />
be measured in MNBCs (1). The MMP reflects the<br />
functional status of the mitochondria and is believed to be<br />
a measure of direct stimulation by thyroid hormone. The<br />
MMP can be determined by flow cytometry analysis of<br />
fluorescence of MTG-stained MNBCs (2;3). Euthyroid<br />
values of serum TSH and fT3 are inversely correlated to<br />
age in children and adolescents (4).<br />
Aim of study<br />
To examine whether thyroid hormone effect on mitochondrial function is related to age.<br />
Lean female children (age group A: 9-13 years of age,<br />
n=11, Body Mass Index < 80, age matched percentile),<br />
lean female adolescents (age group B: 15-20 years of age,<br />
n=9, Body Mass Index = 20-22 kg/m2) and lean female<br />
adults (age group C: 32-52 years of age, n=19, Body Mass<br />
Index= 21-24 kg/m2) from the pediatric outpatient clinic,<br />
Naestved Hospital, <strong>Region</strong> Zealand, Denmark<br />
participated in the study. Height and weight were<br />
measured and analysis of TSH and free T3 was performed<br />
by electrochemical luminescent immunoassay.<br />
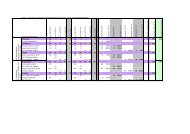
Results<br />
Table 1<br />
Genomic<br />
Age group A Age group B Age group C Kruska-Wallis ANOVA<br />
fT3 pmol/l 6.50 (5.80-7.10) 6.40 (6.10-6.65) 4.90 (4.50-5.60)<br />
VO2 ml O2/min*m2 137 (134-157) 120 (113-121) 118 (112-128)<br />
Direct effect<br />
A vs C p