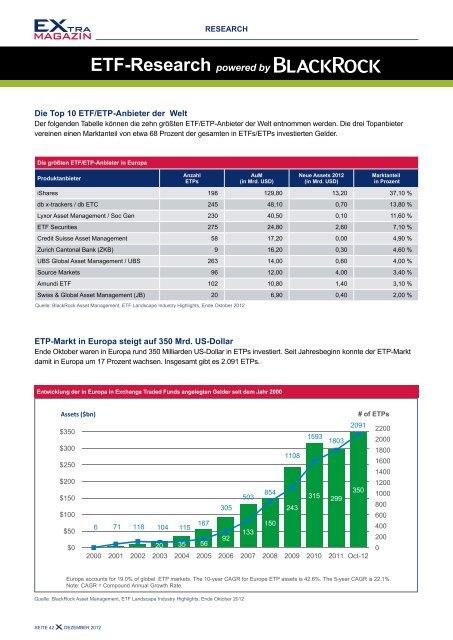
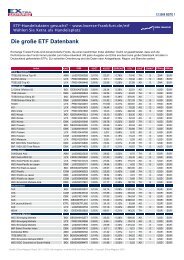
ResearchETF-Research powered byDie Top 10 ETF/ETP-Anbieter der WeltDer folgenden Tabelle können die zehn größten ETF/ETP-Anbieter der Welt entnommen werden. Die drei Topanbietervereinen einen Marktanteil von etwa 68 Prozent der gesamten in ETFs/ETPs investierten Gelder.Die größten ETF/ETP-Anbieter in EuropaProduktanbieterAnzahlETPsAuM(in Mrd. USD)Neue Assets 2012(in Mrd. USD)Marktanteilin ProzentiShares 198 129,80 13,20 37,10 %db x-trackers / db ETC 245 48,10 0,70 13,80 %Lyxor Asset Management / Soc Gen 230 40,50 0,10 11,60 %ETF Securities 275 24,80 2,60 7,10 %Credit Suisse Asset Management 58 17,20 0,00 4,90 %Zurich Cantonal Bank (ZKB) 9 16,20 0,30 4,60 %UBS Global Asset Management / UBS 263 14,00 0,60 4,00 %Source Markets 96 12,00 4,00 3,40 %Amundi ETF 102 10,80 1,40 3,10 %Swiss & Global Asset Management (JB) 20 6,90 0,40 2,00 %Quelle: BlackRock Asset Management, ETF Landscape Industry Highlights, Ende Oktober 2012ETP-Markt in Europa steigt auf 350 Mrd. US-DollarEnde Oktober Europe waren in ETP Europa multi-Year rund 350 Milliarden asset US-Dollar Growth in ETPs investiert. Seit Jahresbeginn konnte der ETP-Marktdamit in Europa um 17 Prozent wachsen. Insgesamt gibt es 2.091 ETPs.and Top 10 ProvidersEurope ETP assets & Number of ETPs by YearEntwicklung der in Europa in Exchange Traded Funds angelegten Gelder seit dem Jahr 2000305Assets ($bn)# of ETPs$3501593 1803 200020912200$300180011081600$2501400$2001200$15050385435031510002998002431506 71 118 104 115 167 400$501339220020 35 56$00$1006002000 2001 2002 2003 2004 2005 2006 2007 2008 2009 2010 2011 Oct-12Europe accounts for 19.0% of global ETP markets. The 10-year CAGR for Europe ETP assets is 42.6%. The 5-year CAGR is 22.1%.Note: CAGR = Compound Annual Growth Rate.Quelle: BlackRock Asset Management, ETF Landscape Industry Highlights, Ende Oktober 2012Europe ETP Providers ranked by assetsSeite 42 Dezember 2012Provider# ETPsOct-2012 % market 1-month YTdYTd-2012 Change
ResearchETF-Research powered byTop 10 ETFs im ÜberblickDie Grafik zeigt die zehn ETFs mit den größtenETF-Entwicklung 2012Die Grafik zeigt die Entwicklung des ETF-VolumenMittelzuflüssen in Europa.Global ETP Flows by listing im Jahr region 2012 in den wichtigsten Regionen.October Flow highlights (uS$):Top 10 ETPs nach Assets under Management (Inflow)Entwicklung October des ETP ETF-Volumens Net Flows by je Region listing im region Jahr 2012ETPs listed in the US account for 70% ofETFInflow-AuMglobal ETP assets and 71% of global YTD(US$bn)net inflows. Note that many of these USlistedproducts provide exposure to otherin Mio. USDPhysical Gold Source P-ETCregions. The amounts on this pageUS2.81.284represent the “listed-view”, not theGBS Bullion Securities“exposure-view.”1.232iShares Barcap Euro Corporate ex-Finan.ETPs listed in Europe gathered solidinflows 1.203 of $4.6bn in October andEurope4.6iShares MSCI Emerging Marketsaccounted for 42% of global inflows,largely 1.105 due to below-average inflows inCanada0.6iShares MSCI Worldthe US region. October was the thirdconsecutive 1.028 month of flows greater thanETFS Physical Gold$4bn, and YTD Europe listed ETPs haveexceeded 9922011 annual inflows. Flows ofLatin America0.3iShares JPM $ EM Bond Fund$0.8bn this month in Europe listed Pan-European 959equity ETPs suggest that fearsiShares Markit iBoxx Euro High Yield Bondof a near-term Eurozone break-up have Asia Pacificsubsided 813following ECB commitments to2.6iShares Markit iBoxx $ High Yield Cappedbackstop sovereign bond markets.688($10) ($5) $0 $5iShares EURO STOXX 50 655Equity Fixed Income Commodities/OthersQuelle: BlackRock Asset Management, ETF Landscape Industry Highlights,index Ende Oktober Provider 2012 market ShareQuelle: BlackRock Asset Management, ETF Landscape Industry Highlights,Ende October 2012listing region view (uS$bn)index Provider market share differs materially by category of exposure:• S&P Dow Jones accounts for 58% of US Equity ETP assets - largely By listing driven by region the popular S&P 500 index -Marktanteileand holds #2 marketdershareIndexanbieterin the Global Equity ETP category2012Die Grafik • MSCI holds zeigt #1 share die across Marktanteile a number of Equity der categories Indexanbieter including Other Developed nach Assets (ex-US), Emerging und der jeweiligen Region.Global ETP Total 10.9 193.7 1,839.4 100 4,721Markets, and Global• Russell-based ETPs are focused solely in the US Equity category US 2.8 138.3 1,288.3 70.0 1,441• STOXX-based ETPs provide exposure to the European Equity marketEurope 4.6 24.2 349.9 19.0 2,091Monatiches ETF-Handelsvolumen market Share (Tagesbasis)of ETP Equity assets Canada by Exposure0.6 10.0 54.3 3.0 263OctNet FlowsYTd2012Oct2012assets% assetmarketShareNumber ofProducts100%90%80%70%60%50%40%30%20%10%uS Equity$664bnS&P dow Jones – 58%mSCi – 14%russell – 13%Other Providers - 15%Other developedEmerging Global*Latin America 0.3 (0.4) 11.2 0.6 34$256bnmarkets $231bn $137bnSTOXX – 30%ETP = Exchange traded products. Global ETP flows are approximated by combining the US, Europe, Canada, Asia Pacific and LatinAmerica. Europe flows are as of Oct 30th,2012 and some S&P Asia Pacific 500 flows Index). are reported on a one month lag. All other data is as of Oct31st , 2012. September assets and YTD flows have been restated to include lagged Asia Pacific funds.Source: BlackRock Investment Institute,mSCiBloomberg,– 51%National Stock Exchange (NSX).mSCi – 25%S&P dowJones – 12%Other – 33%Asia Pacific 2.6 21.6 115.9 6.3 532Middle East and AfricamSCi –60%FTSE – 9%Other - 31%NotAvailableS&P dowJones -15%FTSE – 11%Other 23%NotS&P Dow Jones 19.8hat 58 Prozent 1.1 Marktanteil360Availablebei US Aktienindizes (im Wesentlichen derMSCI führt weltweit verschiedene Aktienkategorien,u. a. die Schwellenländer,FOR PROFESSIONAL INVESTORS ONLY8an.Russell-basierte Indizes basieren im wesentlichenauf US-Aktienindizes.STOXX Indizes bieten überwiegend einenZugang zu den europäischen Aktienmärkten.0%0 $300 $600 $900 $1,200 $1,287Note: Data as of end of September 2012Equity ETP assets (uS$bn)Sources: BlackRock Investment Institute, BloombergQuelle: Asset Management, ETF Landscape Industry Highlights, Ende October 2012* Global also includes Global ex-US exposuresFOR PROFESSIONAL INVESTORS ONLY7Seite 43 DEZEMBER 2012