
Erfolgreiche ePaper selbst erstellen
Machen Sie aus Ihren PDF Publikationen ein blätterbares Flipbook mit unserer einzigartigen Google optimierten e-Paper Software.
<strong>atw</strong> Vol. 62 (<strong>2017</strong>) | Issue 8/9 ı August/September<br />
ENERGY POLICY, ECONOMY AND LAW 516<br />
commercial reactor in the US at the time. Ikata 1 was due<br />
to end its 40-year operating period in September <strong>2017</strong>.<br />
Novovoronezh 3 was the oldest VVER 440 reactor in<br />
operation, first producing electricity 45 years previously.<br />
| | Fig. 3.<br />
Regional generation of nuclear electricity, North America, South America,<br />
Africa, West & Central Europe, East Europe & Russia, Asia.<br />
In 2016 nuclear generation was higher in all regions<br />
except Western and Central Europe, compared to the<br />
average annual generation in the preceding five years<br />
(Figure 3). Nuclear output rose most markedly in Asia,<br />
with generation 72 TWh higher than the 2011-2015<br />
average.<br />
In 2014 the share of nuclear generation in the global<br />
electricity generation mix held steady at 10.6%, unchanged<br />
from 2013. In those countries that have nuclear generation<br />
the share supplied by nuclear rose from 12.3 % in 2013 to<br />
13.6 % in 2014 (Figure 4).<br />
total electricity supply has stabilized. The continuing<br />
increase in nuclear generation seen over the last two years<br />
should see these trends continue.<br />
Operational performance<br />
The World Nuclear Performance Report assesses reactors<br />
capacity factors based on the performance of those reactors<br />
that generated electricity during each calendar year<br />
(Figure 5). This omits those reactors, such as those<br />
awaiting restart in Japan, that are classed as operable, but<br />
did not generate. This treatment gives a better indication<br />
of the long term performance trends of operating reactors.<br />
There have been two phases in the trends for reactor<br />
performance in terms of global average capacity factor.<br />
Since around 2001 the global average capacity factor has<br />
held at around 80 %. Prior to this phase there was an<br />
approximately 30 year period of steady improvement.<br />
In 2016 the global average capacity factor was 80.5 %, in<br />
comparison to 81.0 % in 2015.<br />
Although the global overage average has stabilized<br />
there are variations, with some regions achieving higher<br />
capacity factors (Figure 6). In North America capacity<br />
factors approached 90 %, for example.<br />
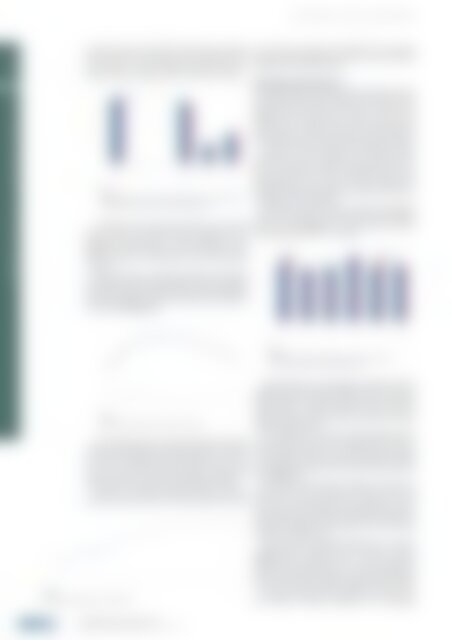
| | Fig. 6.<br />
Capacity factor by region, North America, South America, Africa,<br />
West & Central Europe, East Europe & Russia, Asia.<br />
Since 1996 the share of nuclear generation in the global<br />
energy mix has fallen from a peak of around 17 % to just<br />
over 10 %. This decline in the overall share is in part due to<br />
an increase in global electricity demand and in part<br />
because a decline in nuclear generation, particularly in<br />
2011 and 2012, in response to the Fukushima accident.<br />
However, as nuclear generation started to increase<br />
again from 2012 the share of nuclear generation in the<br />
| | Fig. 5.<br />
Global average capacity factor 1970 to 2016.<br />
| | Fig. 4.<br />
Share of nuclear generation in total electricity supply.<br />
Capacity factors are also broadly consistent with the<br />
average achieved in the preceding five years for reactors in<br />
different regions. The greatest variation is seen in regions<br />
represented by a smaller number of reactors where the<br />
regular schedule of outages results in variations in average<br />
regional capacity factors.<br />
The percentage of reactors reaching specific capacity<br />
factors in 2016, compared to the average for each year over<br />
the preceding five years has remained fairly consistent<br />
over this period and there has been no significant change<br />
to the spread of capacity factors achieved across the fleet<br />
either (Figure 7).<br />
The chart shows that there remains some scope for<br />
improvements in the performance of those reactors with<br />
lower than average capacity factors. However, in some<br />
cases reactors are being used in a load-following mode that<br />
means their output is reduced to help balance variations in<br />
demand and supply from other generators, with a resulting<br />
reduction in capacity factor.<br />
There has been ongoing improvement of reactors<br />
reaching higher capacity factors over the last 40 years<br />
(Figure 8). For example, 64 % of reactors achieved<br />
capacity factor higher than 80 % in 2016, compared to<br />
24 % in 1976, whereas only 8 % of reactors had a capacity<br />
factor lower than 50 % in 2016, compared to 22 % in 1976.<br />
One area of interest is the performance of reactors over<br />
their lifetime. Extended operations are increasingly<br />
Energy Policy, Economy and Law<br />
World Nuclear Performance Report <strong>2017</strong> ı Jonathan Cobb