Pallet-Management-Services - AFM
Pallet-Management-Services - AFM
Pallet-Management-Services - AFM

Create successful ePaper yourself
Turn your PDF publications into a flip-book with our unique Google optimized e-Paper software.
| ANNUAL REPORT 2006 | IFCO SYSTEMS N.V. |<br />
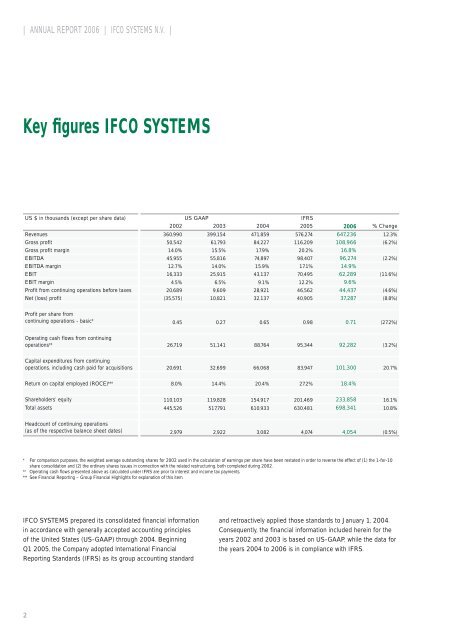
Key fi gures IFCO SYSTEMS<br />
US $ in thousands (except per share data) US GAAP IFRS<br />
2002 2003 2004 2005 2006 % Change<br />
Revenues 360,990 399,154 471,859 576,274 647,236 12.3%<br />
Gross profit 50,542 61,793 84,227 116,209 108,966 (6.2%)<br />
Gross profit margin 14.0% 15.5% 17.9% 20.2% 16.8%<br />
EBITDA 45,955 55,816 74,897 98,407 96,274 (2.2%)<br />
EBITDA margin 12.7% 14.0% 15.9% 17.1% 14.9%<br />
EBIT 16,333 25,915 43,137 70,495 62,289 (11.6%)<br />
EBIT margin 4.5% 6.5% 9.1% 12.2% 9.6%<br />
Profit from continuing operations before taxes 20,689 9,609 28,921 46,562 44,437 (4.6%)<br />
Net (loss) profit (35,575) 10,821 32,137 40,905 37,287 (8.8%)<br />
Profit per share from<br />
continuing operations - basic* 0.45 0.27 0.65 0.98 0.71 (27.2%)<br />
Operating cash flows from continuing<br />
operations** 26,719 51,141 88,764 95,344 92,282 (3.2%)<br />
Capital expenditures from continuing<br />
operations, including cash paid for acquisitions 20,691 32,699 66,068 83,947 101,300 20.7%<br />
IFCO SYSTEMS prepared its consolidated financial information<br />
in accordance with generally accepted accounting principles<br />
of the United States (US-GAAP) through 2004. Beginning<br />
Q1 2005, the Company adopted International Financial<br />
Reporting Standards (IFRS) as its group accounting standard<br />
2<br />
Return on capital employed (ROCE)*** 8.0% 14.4% 20.4% 27.2% 18.4%<br />
Shareholders’ equity 110,103 119,828 154,917 201,469 233,858 16.1%<br />
Total assets 445,526 517,791 610,933 630,481 698,341 10.8%<br />
Headcount of continuing operations<br />
(as of the respective balance sheet dates) 2,979 2,922 3,082 4,074 4,054 (0.5%)<br />
* For comparison purposes, the weighted average outstanding shares for 2002 used in the calculation of earnings per share have been restated in order to reverse the effect of (1) the 1-for-10<br />
share consolidation and (2) the ordinary shares issues in connection with the related restructuring, both completed during 2002.<br />
** Operating cash fl ows presented above as calculated under IFRS are prior to interest and income tax payments.<br />
*** See Financial Reporting – Group Financial Highlights for explanation of this item.<br />
and retroactively applied those standards to January 1, 2004.<br />
Consequently, the financial information included herein for the<br />
years 2002 and 2003 is based on US-GAAP, while the data for<br />
the years 2004 to 2006 is in compliance with IFRS.