PRICEWATERHOUSECOOPERS doo - American Chamber of ...
PRICEWATERHOUSECOOPERS doo - American Chamber of ...
PRICEWATERHOUSECOOPERS doo - American Chamber of ...

You also want an ePaper? Increase the reach of your titles
YUMPU automatically turns print PDFs into web optimized ePapers that Google loves.
26<br />
<strong>American</strong> <strong>Chamber</strong> <strong>of</strong> Commerce in Croatia YEARBOOK 2010<br />
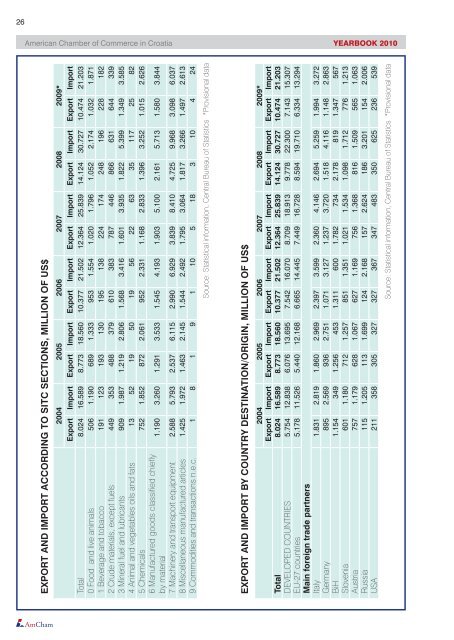
EXPORT AND IMPORT ACCORDING TO SITC SECTIONS, MILLION OF US$<br />
2004 2005 2006 2007 2008 2009*<br />
Export Import Export Import Export Import Export Import Export Import Export Import<br />
Total 8.024 16.589 8.773 18.560 10.377 21.502 12.364 25.839 14.124 30.727 10.474 21.203<br />
0 Food and live animals 506 1.190 689 1.333 953 1.554 1.020 1.796 1.052 2.174 1.032 1.871<br />
1 Beverage and tobacco 191 123 193 130 195 138 224 174 248 196 228 182<br />
2 Crude materials, except fuels 449 353 488 379 610 383 787 446 866 631 644 339<br />
3 Mineral fuel and lubricants 909 1.987 1.219 2.806 1.568 3.416 1.601 3.935 1.822 5.399 1.349 3.585<br />
4 Animal and vegetables oils and fats 13 52 19 50 19 56 22 63 35 117 25 82<br />
5 Chemicals 752 1.852 872 2.061 952 2.331 1.168 2.833 1.396 3.252 1.015 2.626<br />
6 Manufactured goods classified chiefly<br />
1.190 3.260 1.291 3.533 1.545 4.193 1.903 5.100 2.161 5.713 1.580 3.844<br />
by material<br />
7 Machinery and transport equipment 2.588 5.793 2.537 6.115 2.990 6.929 3.839 8.410 4.725 9.968 3.098 6.037<br />
8 Miscellaneous manufactured articles 1.425 1.972 1.463 2.145 1.544 2.492 1.795 3.064 1.817 3.266 1.497 2.613<br />
9 Commodities and transactions n.e.c. 1 8 1 9 1 10 5 18 3 10 4 24<br />
Source: Statistical information, Central Bureau <strong>of</strong> Statistics *Provisional data<br />
EXPORT AND IMPORT BY COUNTRY DESTINATION/ORIGIN, MILLION OF US$<br />
2004 2005 2006 2007 2008 2009*<br />
Export Import Export Import Export Import Export Import Export Import Export Import<br />
Total 8.024 16.589 8.773 18.560 10.377 21.502 12.364 25.839 14.124 30.727 10.474 21.203<br />
DEVELOPED COUNTRIES 5.754 12.838 6.076 13.695 7.542 16.070 8.709 18.913 9.778 22.300 7.143 15.307<br />
EU-27 countries 5.178 11.526 5.440 12.168 6.665 14.445 7.449 16.728 8.594 19.710 6.334 13.294<br />
Main foreign trade partners<br />
Italy 1.831 2.819 1.860 2.969 2.397 3.599 2.360 4.146 2.694 5.259 1.994 3.272<br />
Germany 895 2.569 936 2.751 1.071 3.127 1.237 3.720 1.518 4.116 1.148 2.863<br />
BiH 1.154 349 1.256 453 1.311 600 1.782 734 2.178 819 1.347 567<br />
Slovenia 601 1.180 712 1.257 851 1.351 1.021 1.534 1.098 1.712 776 1.213<br />
Austria 757 1.179 628 1.067 627 1.169 756 1.368 816 1.509 565 1.063<br />
Russia 115 1.205 113 1.699 124 2.168 157 2.624 186 3.201 154 2.006<br />
USA 211 358 305 327 327 367 347 483 350 625 236 539<br />
Source: Statistical information, Central Bureau <strong>of</strong> Statistics *Provisional data