from indigenous fermented foods and human gut ... - Thapar University
from indigenous fermented foods and human gut ... - Thapar University
from indigenous fermented foods and human gut ... - Thapar University
You also want an ePaper? Increase the reach of your titles
YUMPU automatically turns print PDFs into web optimized ePapers that Google loves.
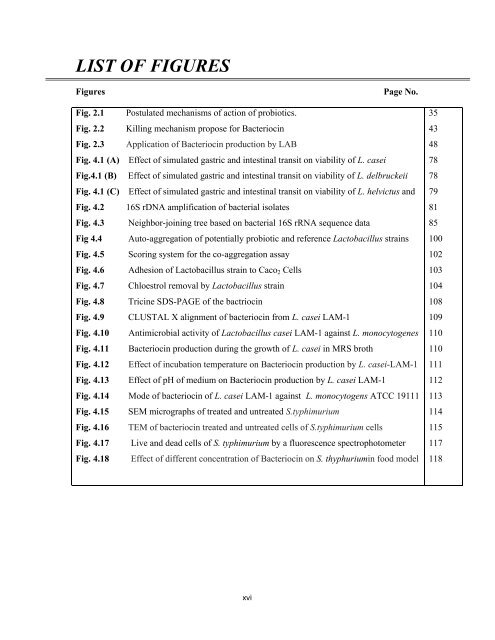
LIST OF FIGURES<br />
Figures Page No.<br />
Fig. 2.1 Postulated mechanisms of action of probiotics.<br />
Fig. 2.2 Killing mechanism propose for Bacteriocin<br />
Fig. 2.3 Application of Bacteriocin production by LAB<br />
Fig. 4.1 (A) Effect of simulated gastric <strong>and</strong> intestinal transit on viability of L. casei<br />
Fig.4.1 (B) Effect of simulated gastric <strong>and</strong> intestinal transit on viability of L. delbruckeii<br />
Fig. 4.1 (C) Effect of simulated gastric <strong>and</strong> intestinal transit on viability of L. helvictus <strong>and</strong><br />
Fig. 4.2 16S rDNA amplification of bacterial isolates<br />
Fig. 4.3 Neighbor-joining tree based on bacterial 16S rRNA sequence data<br />
Fig 4.4 Auto-aggregation of potentially probiotic <strong>and</strong> reference Lactobacillus strains<br />
Fig. 4.5 Scoring system for the co-aggregation assay<br />
Fig. 4.6 Adhesion of Lactobacillus strain to Caco2 Cells<br />
Fig. 4.7 Chloestrol removal by Lactobacillus strain<br />
Fig. 4.8 Tricine SDS-PAGE of the bactriocin<br />
Fig. 4.9 CLUSTAL X alignment of bacteriocin <strong>from</strong> L. casei LAM-1<br />
Fig. 4.10 Antimicrobial activity of Lactobacillus casei LAM-1 against L. monocytogenes<br />
Fig. 4.11 Bacteriocin production during the growth of L. casei in MRS broth<br />
Fig. 4.12 Effect of incubation temperature on Bacteriocin production by L. casei-LAM-1<br />
Fig. 4.13 Effect of pH of medium on Bacteriocin production by L. casei LAM-1<br />
Fig. 4.14 Mode of bacteriocin of L. casei LAM-1 against L. monocytogens ATCC 19111<br />
Fig. 4.15 SEM micrographs of treated <strong>and</strong> untreated S.typhimurium<br />
Fig. 4.16 TEM of bacteriocin treated <strong>and</strong> untreated cells of S.typhimurium cells<br />
Fig. 4.17 Live <strong>and</strong> dead cells of S. typhimurium by a fluorescence spectrophotometer<br />
Fig. 4.18 Effect of different concentration of Bacteriocin on S. thyphuriumin food model<br />
xvi<br />
35<br />
43<br />
48<br />
78<br />
78<br />
79<br />
81<br />
85<br />
100<br />
102<br />
103<br />
104<br />
108<br />
109<br />
110<br />
110<br />
111<br />
112<br />
113<br />
114<br />
115<br />
117<br />
118


