Q3 2010 Analyst Presentation
Q3 2010 Analyst Presentation
Q3 2010 Analyst Presentation

Create successful ePaper yourself
Turn your PDF publications into a flip-book with our unique Google optimized e-Paper software.
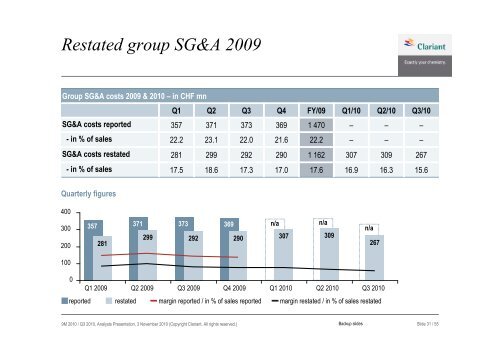
Restated group SG&A 2009<br />
Group SG&A costs 2009 & <strong>2010</strong> – in CHF mn<br />
SG&A costs reported<br />
- in % of sales<br />
SG&A costs restated<br />
- in % of sales<br />
Quarterly figures<br />
400<br />
300<br />
200<br />
100<br />
0<br />
reported restated<br />
Q1<br />
357<br />
22.2<br />
281<br />
17.5<br />
Q2<br />
371<br />
23.1<br />
299<br />
18.6<br />
357 371 373 369<br />
281<br />
9M <strong>2010</strong> / <strong>Q3</strong> <strong>2010</strong>, <strong>Analyst</strong>s <strong>Presentation</strong>, 3 November <strong>2010</strong> (Copyright Clariant. All rights reserved.)<br />
<strong>Q3</strong><br />
373<br />
22.0<br />
292<br />
17.3<br />
369<br />
21.6<br />
290<br />
17.0<br />
FY/09<br />
1 470<br />
22.2<br />
1 162<br />
17.6<br />
299 292 290 307 309<br />
Q1/10<br />
Q1 2009 Q2 2009 <strong>Q3</strong> 2009 Q4 2009 Q1 <strong>2010</strong> Q2 <strong>2010</strong> <strong>Q3</strong> <strong>2010</strong><br />
–<br />
–<br />
307<br />
16.9<br />
margin reported / in % of sales reported margin restated / in % of sales restated<br />
n/a<br />
Q4<br />
n/a<br />
Backup slides<br />
n/a<br />
267<br />
Q2/10<br />
–<br />
–<br />
309<br />
16.3<br />
<strong>Q3</strong>/10<br />
–<br />
–<br />
267<br />
15.6<br />
Slide 31 / 55