Q3 2010 Analyst Presentation
Q3 2010 Analyst Presentation
Q3 2010 Analyst Presentation

You also want an ePaper? Increase the reach of your titles
YUMPU automatically turns print PDFs into web optimized ePapers that Google loves.
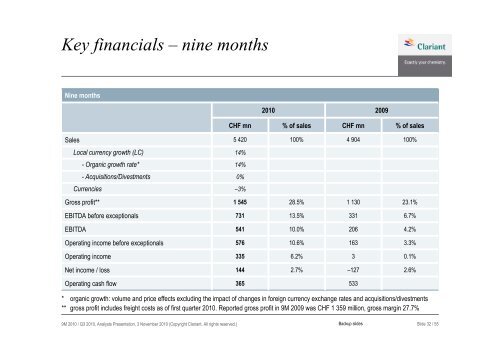
Key financials – nine months<br />
Nine months<br />
Sales<br />
Local currency growth (LC)<br />
- Organic growth rate*<br />
- Acquisitions/Divestments<br />
Currencies<br />
Gross profit**<br />
EBITDA before exceptionals<br />
EBITDA<br />
Operating income before exceptionals<br />
Operating income<br />
Net income / loss<br />
Operating cash flow<br />
9M <strong>2010</strong> / <strong>Q3</strong> <strong>2010</strong>, <strong>Analyst</strong>s <strong>Presentation</strong>, 3 November <strong>2010</strong> (Copyright Clariant. All rights reserved.)<br />
CHF mn<br />
5 420<br />
14%<br />
14%<br />
0%<br />
–3%<br />
1 545<br />
731<br />
541<br />
576<br />
335<br />
144<br />
365<br />
<strong>2010</strong><br />
% of sales<br />
100%<br />
28.5%<br />
13.5%<br />
10.0%<br />
10.6%<br />
6.2%<br />
2.7%<br />
CHF mn<br />
4 904<br />
1 130<br />
331<br />
–127<br />
533<br />
2009<br />
% of sales<br />
* organic growth: volume and price effects excluding the impact of changes in foreign currency exchange rates and acquisitions/divestments<br />
** gross profit includes freight costs as of first quarter <strong>2010</strong>. Reported gross profit in 9M 2009 was CHF 1 359 million, gross margin 27.7%<br />
206<br />
163<br />
3<br />
Backup slides<br />
100%<br />
23.1%<br />
6.7%<br />
4.2%<br />
3.3%<br />
0.1%<br />
2.6%<br />
Slide 32 / 55