Q3 2010 Analyst Presentation
Q3 2010 Analyst Presentation
Q3 2010 Analyst Presentation

Create successful ePaper yourself
Turn your PDF publications into a flip-book with our unique Google optimized e-Paper software.
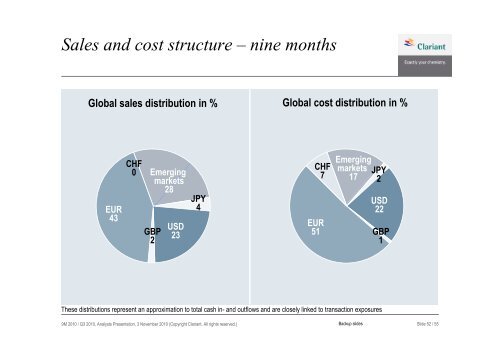
Sales and cost structure – nine months<br />
Global sales distribution in % Global cost distribution in %<br />
EUR<br />
43<br />
CHF<br />
0<br />
Emerging<br />
markets<br />
28<br />
GBP<br />
2<br />
USD<br />
23<br />
JPY<br />
4<br />
These distributions represent an approximation to total cash in- and outflows and are closely linked to transaction exposures<br />
9M <strong>2010</strong> / <strong>Q3</strong> <strong>2010</strong>, <strong>Analyst</strong>s <strong>Presentation</strong>, 3 November <strong>2010</strong> (Copyright Clariant. All rights reserved.)<br />
CHF<br />
7<br />
EUR<br />
51<br />
Emerging<br />
markets<br />
17<br />
Backup slides<br />
JPY<br />
2<br />
USD<br />
22<br />
GBP<br />
1<br />
Slide 52 / 55