Q3 2010 Analyst Presentation
Q3 2010 Analyst Presentation
Q3 2010 Analyst Presentation

Create successful ePaper yourself
Turn your PDF publications into a flip-book with our unique Google optimized e-Paper software.
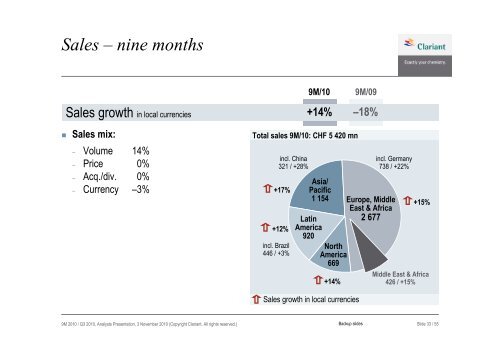
Sales – nine months<br />
Sales growth in local currencies<br />
Sales mix:<br />
– Volume 14%<br />
– Price 0%<br />
– Acq./div. 0%<br />
– Currency –3%<br />
9M <strong>2010</strong> / <strong>Q3</strong> <strong>2010</strong>, <strong>Analyst</strong>s <strong>Presentation</strong>, 3 November <strong>2010</strong> (Copyright Clariant. All rights reserved.)<br />
9M/10<br />
+14%<br />
Total sales 9M/10: CHF 5 420 mn<br />
+17%<br />
+12%<br />
incl. Brazil<br />
446 / +3%<br />
incl. China<br />
321 / +28%<br />
Sales growth in local currencies<br />
Backup slides<br />
9M/09<br />
–18%<br />
incl. Germany<br />
738 / +22%<br />
Asia/<br />
Pacific<br />
1 154 Europe, Middle<br />
Latin<br />
America<br />
920<br />
North<br />
America<br />
669<br />
+14%<br />
East & Africa<br />
2 677<br />
+15%<br />
Middle East & Africa<br />
426 / +15%<br />
Slide 33 / 55